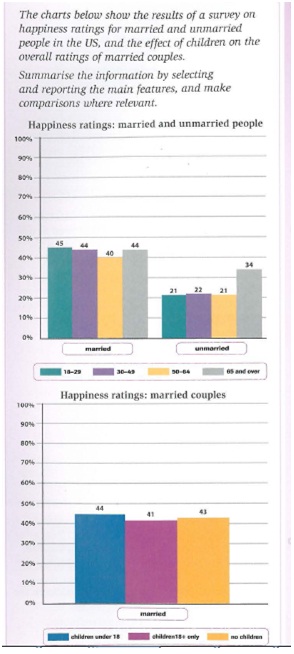
The charts below show the results of a survey on happiness ratings for married and unmarried people in the US and the effect of children on overall rating of married couples. Summaries the information by selecting and reporting the main features, and make comparisons where relevant.
There are two bar charts related to happiness percentages in US. The first shows the pleasure of people before and after married. The second picture illustrates how happy married couple in having children based on three categories. However, people who married is happier than single one, while having children under 18 year old is the happiest rate.
People who married in 18-29 years old are the happiest category. It took 45 percent in percentages. It is contrast with people who got married in age between 50 and 64. This was the least happiness. Overall, the percentages of married are around 40 percent and more. But, people who did not marry, the maximum proportions are only 34 percent. They cannot more pleasure than married one. While the least is the category of 18-29 years old have the same proportion with the 65 and over years old. It was 21 percent.
In the other hand, the effect of having children under 18 years old is the gladdest parent. The calculation was the uppermost. That was approximately 45 percent. The least grouping is married couple who have children more than 18 years old. The percentage was 41, different with the third category that did not have children in their life. They are more enjoying than the second criteria.

us.jpg
