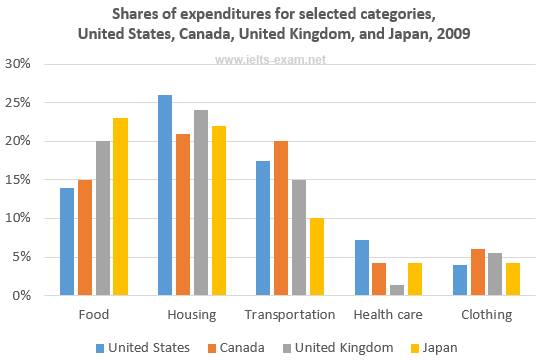
The bar chart gives the information about the proportion of expenditure on five different needs in 4 developed countries in 2009. Overall, except Japan, all countries spent their money on housing.
According to the chart, it is shown that Japan had the highest percentage on food at 23%, but this country becomes the least percentage on transportation at 10%. Furthermore, United States predominated on housing and health care at 26% and 7%, while it was the lowest position on food and clothing. In the same time, Canada reached the best percentage on clothing and transportation even though it was the last position in housing.
Turning to the internal comparison among the needs in every country, Japan and United Kingdom becomes the top spot on housing category, while these countries were the last position on transportation. By contrast, United States and Canada had the highest rate on transportation, but they were the least percentage on food. In case of clothing, except United States, all countries spent their budget for such category.

Bar_chart.jpg
