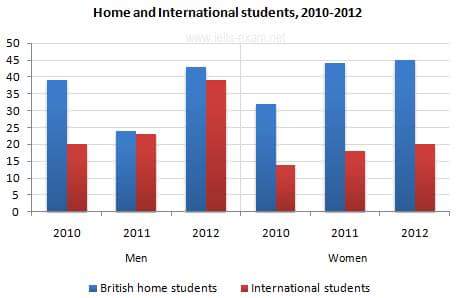
The bar chart describes the amount of UK University students who studying Computer Science during 2 years between 2010 and 2012. Overall, both British and International students, the proportion of men has fallen and rose while women shows that it increased constantly.
The diagram of British home students shows that the men was stood at 48 students in 2010 and then plunged to 23 students in 2011. However, it was increased steadily to 43 students in 2012. By contrast, side, the number of women was increased gradually during three years from 35 students in 2010 to 45 students in 2012.
On the other side, International students highlight that the total number of men rose from 20 students in 2010. Therefore, it increased dramatically from 23 students in 2011 to 38 students in 2012. Besides, the proportion of women increased steadily within the three years from 13 students in 2010 to 20 students in 2012.

FB_IMG_1474968218116.jpg
