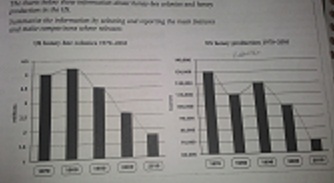
The bar charts give information about the number of honey-bee colonies and the production of the honey in every 10 years start from 1970 to 2010 in the United States. Overall, it can be seen obviously that both of graphs show decreased trends while honey-bee colonies had significantly decline trends, honey production experienced slightly fluctuating trends.
To begin with, the highest number of honey-bee colonies was in 1980, at 4,2 millions while the least was in 2010. In the first 10 years, the number of colonies had slightly incline until reached the peak in 1980 but for the 30 years later show sharp decline at 1,7 millions in 2010.
The honey production experienced a fluctuating trends over 40 years period. The biggest number of production was in 1970, at 130,000 tonnes while the least was in 2010, at 70,000 tonnes. In 1990, the number of honey production had higher humber than other years but had less number than in 1970.

P_20160817_203927.jp.jpg
