Unanswered [7] | Urgent [0]
  

Home / Writing Feedback   % width   Posts: 9


IETLT Task I : Spending leisure time by young individuals and couples


SHanafi 120 / 357  
Feb 11, 2014   #1
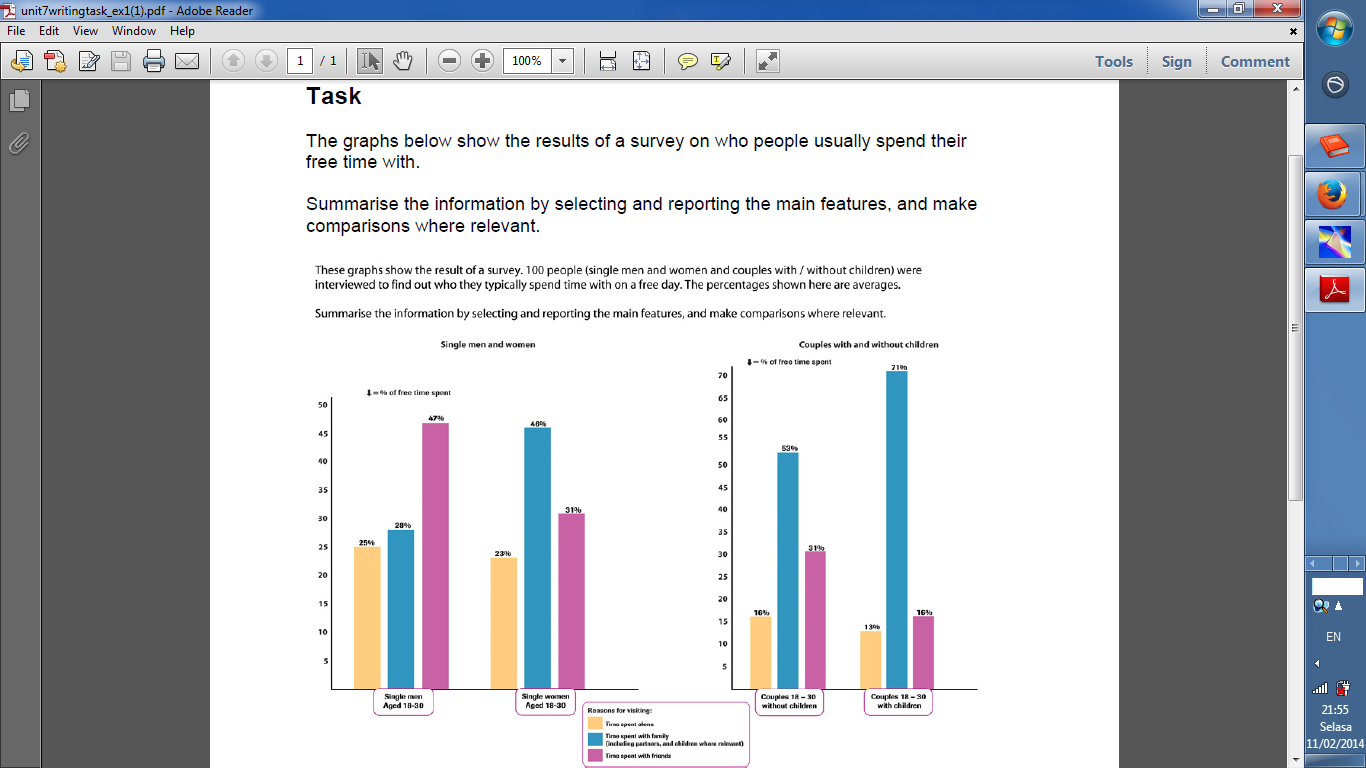
These graphs show the result of a survey, 100 people (single men and women and couples with/without children) were interviewed to find out who they typically spend time with on a free day. The percentage shown here are averages

answer
The bar charts below are results in 1000 people separated in two groups (single and couples). Both of these charts also contain with the average of age and the descendant having that correlated to activity they are chosen in the leisure time.

Overall, both couples are favor to spend their time with family while the singles choose friend and family for most favourite to accompany their leisure.

To begin with, most of single men spend their leisure with friends by 47 per cent besides the other trends, 25 and 28 percent, are use for family gathering or just enjoy free time alone. Likewise, majority of single woman tends to attach with family by 46 per cent rather than take a hang out or enjoy their leisure alone.

The other leisure percentage shows differential especially in couples living. Although both of them are favor to spend time with family, childless family become the second with 53 percent while a couples with children becomes mesmerize with slightly above 70 per cent. However, portion for friend or alone have dramatically decreased merely fewer than 20 per cent.

  • single_and_couple_sp.png


odon 12 / 27  
Feb 11, 2014   #2
Hi Shanafi,
For me , I have not detect any flaw.
JennyPham 2 / 1  
Feb 11, 2014   #3
The bar charts below are results in 1000 people separated in two groups (single and couples).

25 and 28 percent, are use for family gathering or

the comma should be omitted
:)
OP SHanafi 120 / 357  
Feb 11, 2014   #4
hy, jenny

, 25 and 28 percent ,

the comma should be omitted

would you please give me reason why the comma should be omitted ?
I take commas to show them as appositive. Probably you have good advice for my improve
dumi 1 / 6793  
Feb 12, 2014   #5
The bar charts below are results in 1000 people separated in two groups (single and couples). Both of these charts also contain with the average of age and the descendant having that correlated to activity they are chosen in the leisure time.

Well, your intro is a bit too descriptive. Let's look at the title of the charts;
"The graphs below show the results of survey on whom people usually spend their leisure time with" ... So, all you've got to do is to paraphrase the same. Keep all the details for your body paras ;

The bar charts provide the survey results on with whom the selected 100 people usually spend their leisure time with. This group of people include single men, single women, couples with children and couples without children.

Also, the picture says it's 100 people whereas you have said 1000 people. Be careful with figures as this task is about reporting.
sydsyd58 1 / 2  
Feb 12, 2014   #6
Overall, both couples are favor to spend their time with family while the singles choose to spend time with friend and family for most favourite to accompany for their leisure.
Pahan 1 / 1824  
Feb 15, 2014   #7
The bar charts below are results in 1000 people separated in two groups (single and couples).

results of what? better specify!

The bar charts below are results in 1000 people separated in two groups (single and couples). Both of these charts also contain with the average of age and the descendant having that correlated to activity they are chosen in the leisure time.

The bar charts illustrate the results of a survey carried out with the participation of 1000 people who were categorized as single men and women and married couples with and without children. The objective of the survey was to find out with whom these people usually spend their leisure time.
OP SHanafi 120 / 357  
Feb 15, 2014   #8
your intro is a bit too descriptive

as far as my understanding in intro, we can pick general information without numbers.
but your example enlarge my understanding.

it's 100 people whereas you have said 1000 people.

I should be pay more attention. thank you dumi :)
eddies [Contributor] 25 / 1170  
Feb 16, 2014   #9
A few details it takes for grammatical mechanics.

Both of these charts also contain with the average

"Contain" here as a transitive verb, so omit "with"

To begin with,

This phrase is common for IELTS task 2

are used for

children becomesmesmerize

children become mesmerizing . I am not sure that "mesmerizing" here is an appropriate word.

the majority of single womanwomen tends

portionS for friend or alone have

Save 5 to 10 minutes to check your grammatical mechanics.


Home / Writing Feedback / IETLT Task I : Spending leisure time by young individuals and couples
Need Writing or Editing Help?
Fill out one of these forms:

Graduate Writing / Editing:
GraduateWriter form ◳

Best Essay Service:
CustomPapers form ◳

Excellence in Editing:
Rose Editing ◳

AI-Paper Rewriting:
Robot Rewrite ◳

Academic AI Writer:
Custom AI Writer ◳