Number of Work-Loss Days due to illness
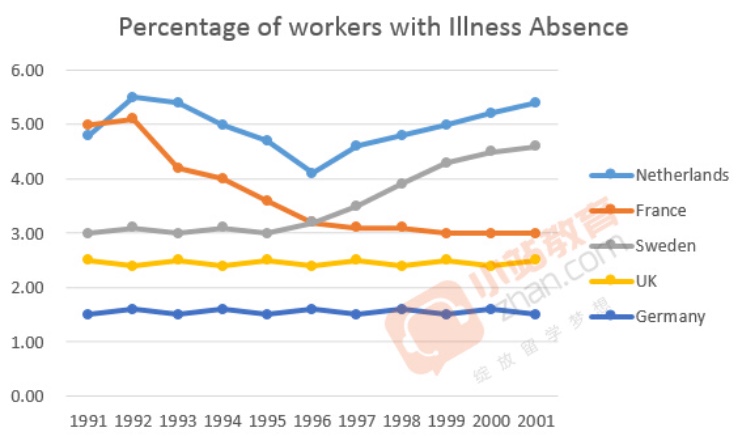
The graph below shows the percentage of workers in 5 different European countries with a days or more illness absence from 1991 to 2001.
The line chart illustrate the percentage of workers absent for illness in 5 countries(namely Netherlands, France, Sweden, the UK and Germany)between 1991 and 2001.
From the graph, the rate of Netherlands starts from almost 5% in 1991 then reach its peak at somewhere in the 5 % in 1992. Then, the rate declines stably for the next 5 years.
Referring to the absence rates of France and Sweden, in the beginning of the period, are 5 % and 3% respectively. While the percentage of sick leave in France declined markedly, the percentage of Sweden climbed stably and both of the rates, in 1995, stood at a slightly more than 3%. After that, the percentage of workers absence due to illness in Sweden had a sustain growth, while France remain in approximately 3%.
It is interesting to see that the percentage of workers with a day or more illness absence in the UK and Germany follow a similar trend. the rates of workers absent for sickness in the UK and Germany are somewhere in the 2.5% and 1.5% respectively.
Overall, it can be seen that there was a considerably fluctuation of percentage of workers have sick leave in Netherlands from 1991 to 2001 and the rate in France shows a rapid decrease during the period in the question.
(232 words, duration: 21:45)
--------------------------------------------------------------
1. I am confused about what tense I should use in what kind of description.
2. I think I may miss the information about workers with days of more illness absence when I tried to paraphrase the question.
3. How do I shorten the essay but still focus to the topic without missing any important information?
I am aiming for finish the essay between 150-180 words within 15 minutes, is it possible?

IMG_E0312.JPG
