Channel one news - comparing statistics about numbers of viewers
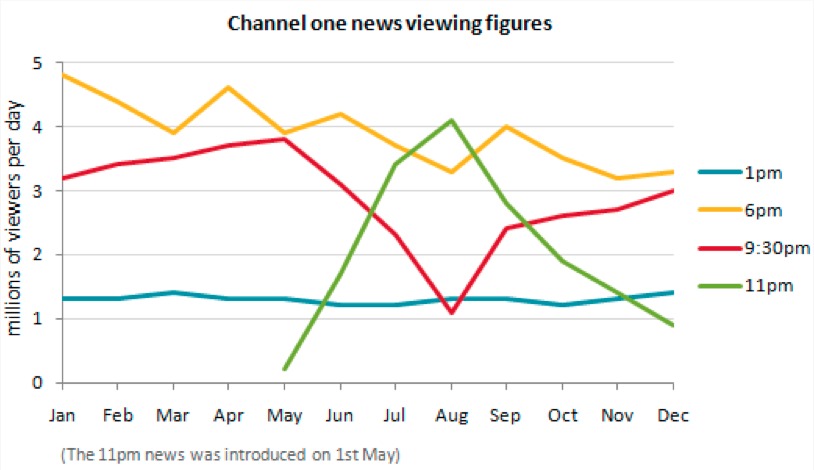
The line chart exhibits information about the average of daily program Channel One News from January to December. The aired time could be divided in two groups as 1 pm and 6 pm figure, and 9:30 pm and 11 pm figure. Overall, all figures experience several changes, and the second group have the most contradictory changes.
The first group has a slight changes on trend over a 12-month period. In the beginning of the year, 1 pm figure stood at above 1 million of viewers, and it stay constant until the end of period. Meanwhile, 6 pm figure has the biggest number of viewers, but it experiences downtrend during a year. However, the first group has significant difference in the first year and it is continuing until the end of period.
The second group has a contradictory changes from May to December. Initially, 9:30 pm figure has about 3 million of viewers, and it peakes in May. Meanwhile, 11 pm figure was introduced in May, and it stood at under 1 million of viewers. Interestingly, 11 pm figure reach a peak at 4 million in August, whereas 9:30 pm figure hits a low of 1 million of viewers.

IMG20170330WA0002..jpg
