Writing task 1, test1 cam 15, Bar chart
This is my writing task 1 for Cambridge 15 test 1. Since I'm going to have an IELTS test in early August, I hope to receive moderators' comments to improve my writing skills. Thanks sincerely.
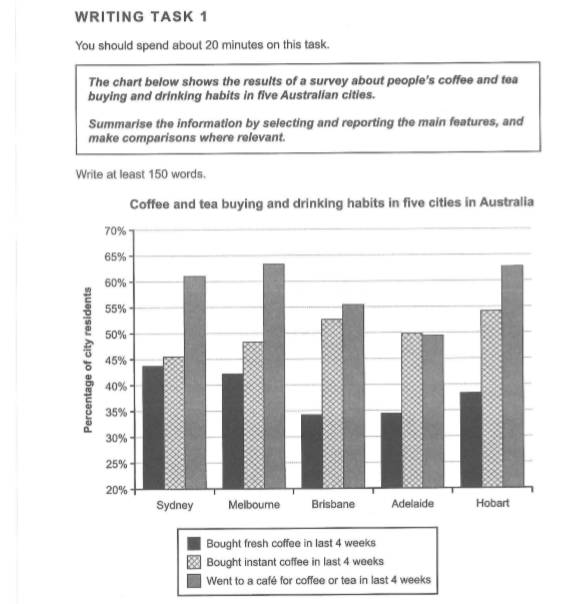
The bar chart illustrates the information on coffee and tea consumption and interest in drinks in 5 Australia cities.
Overall, it can be seen that Australian tended to enjoy drinking coffee/tea in a cafe rather than making coffee by themselves. Besides, instant coffee seemed to be more popular than the fresh one in all 5 cities.
In detail, over half of the population in 4 cities were interesting in having coffee/tea in a cafe, especially in Melbourne, the figure was 63%. Compared to people in other cities, residents in Adelaide showed the lowest interest since there were just 49% of them choose to go to a cafe shop.
Regarding instant coffee, Hobart and Brisbane had the largest consumption, which was nearly 55% and 53% of people bought this kind, respectively. In comparison, fresh coffee seemed to be the last choice of Australian as the percentage of residents who bought it was always lower than 45% during the period shown. In Brisbane, the figure was even beneath 35%.

cam15t1task1.png
