diarrhea instances figure
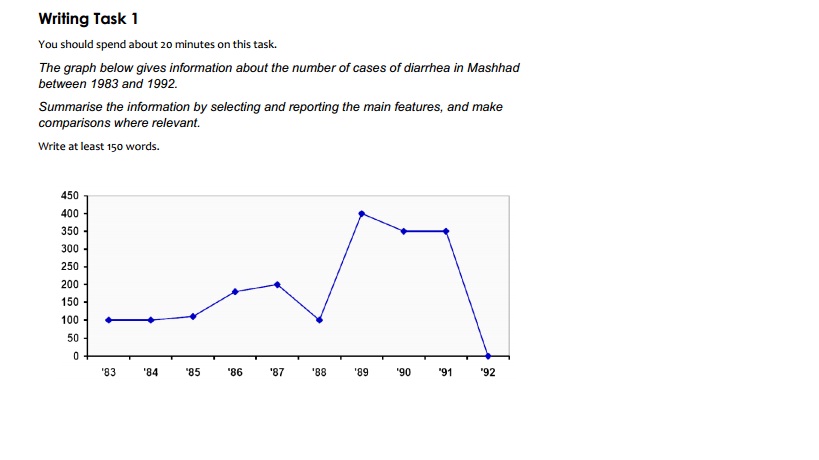
The line chart provides data about the changes of number of diarrhea cases occuring in Mashhad from 1983 to 1992. Overall, the figures of diarhhea cases dropped significantly at the end of given period despite fluctuations occur over time. Besides, they were at their highest in '89 while the lowest figures could be observed in '92.
In the three first years ('83, '84, '85), they stood at 100 and remained relatively unchanged. The figure then rose considerably to reach about 190 in '96. A year after that, this was followed by a slight increase to the level of 200. However, this upward trend was suddenly broken and the number of diarhhea sufferings plummeted dramatically back to the initial level in '88.
Afterwards, an enormous surge was seen in '88; fourfold higher than the former figure. Nevertheless, in the following year, a plunge appear tp 300 and the figure remained steady until '91. Interestingly, the figure dipped tremendously and hit the zero level of diarhhea cases in the last given period.

untuk_essay_forum.jp.jpg
