Please note that the next time you provide a useless comment in other student's thread, your account will be suspended. Remember also about giving good, unique titles for your threads
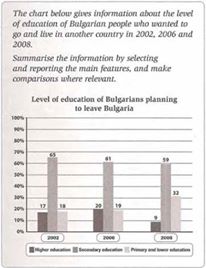
The bar chart provides information about the grade of education which is elected by Bulgarian people who desire to go and stay in another country in some years, 2002, 2006, and 2008, respectively. At first glance it is evident that, most of Bulgarian people who wanted to go and lived in another country was in secondary education level which was the highest level in every year than another level of education, higher education and primary and lower education.
With regards to secondary education, the figure for people with that level stood at 65% in 2002, and it was a peak among 3 years. Afterwards, this category declined minimally at least 4%, which was followed a small fall to 59% in the next year.
Turning to other levels, the figure for people with primary and lower education rose each year. In 2002, it was stood at 18%, and then showed an upward trend in other years, 19% in 2006. Subsequently, the figure peak at 32% in 2008. Next, another category was people with higher education. The figure for people with higher education stood at 17% in 2002, and then rose minimally to 20% in 2006, which was followed a significant drop to 9% in 2008.

12782125_12232004943.jpg
