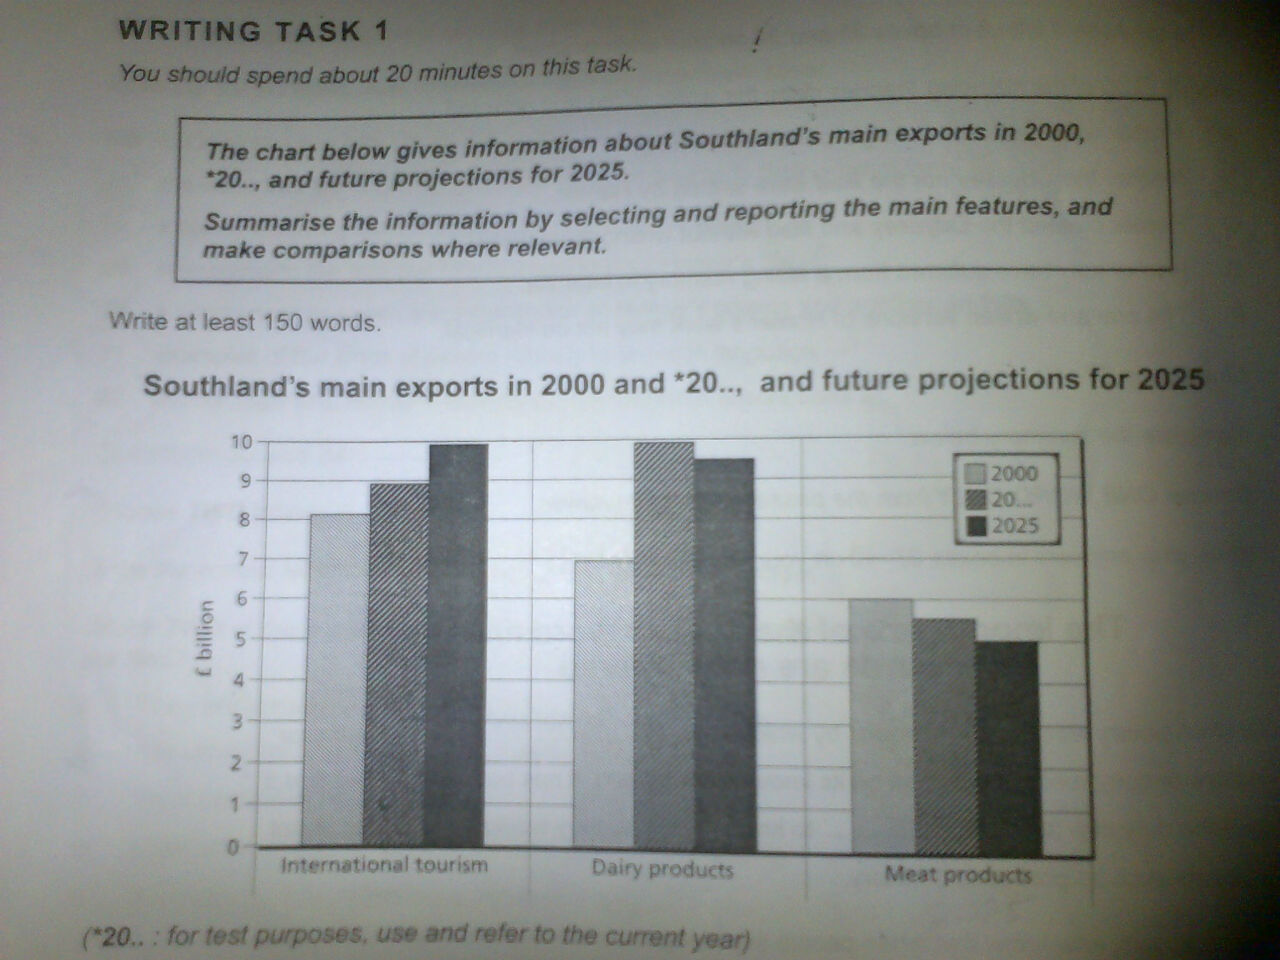
The chart below gives information about Southland's main exports in 2000, 2015, and future projections for 2025.
The bar chart gives information about the primary export commodities of Southland in 2000, 2015 and it makes prediction for 2025 in £billion. It is noticeable that the three commodities dominate the exports during the three different years.
Moving to a more detailed analysis, meat products reached its highest level at almost 10 in 2000, and then there will be a slight decrease until 2025. This type of commodity is predicted to reach the lowest at 5. On the other hand, 2015 is dominated by dairy products export at around the same level as international tourism exports 15 years ago. As for the prediction in 2025, international tourism will be the highest of all other commodities.
Turning to the lowest commodity in the three periods, dairy products was the lowest commodity to be exported from 2000 to 2015, and will remain in this position in 2025. While the lowest exports in the next 10 years will be meat products with almost half of the international tourism commodity.

Scoring_WT1_21_May.j.jpg
