PROMPT:
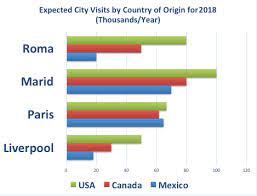
The given chart gives information about the travelling tendency to 4 countries of people in the USA, Canada and Mexico in the year 2018.
Overall, Marid is anticipated to be the most well-known tourist destination, on the contrary, the lowest figure belonged to Liverpool. It is also apparent that there will be a significant disparity in the number of travelers to the capital of France.
According to the current predictions, there will be numerous American visitors in Madrid(100 thousand), compared to the figure for Canadian and Mexican, with 80 thousand and nearly 70 thousand respectively. Similarly, the number of Americans having a trip to Liverpool is likely to stand at somewhere in the vicinity of 50 thousand, which is double and triple as much as the quantity of Canada and Mexico.
Looking at the graph more detail, the year 2008 is estimated to witness an equal number of citizens in these 3 countries travelling to Paris (above 600 thousand). Meanwhile, the figure for Rome is predicted to have the biggest difference among 3 nations, to be specific, there will be approximately 80 thousand American residents compared with just 50 thousand and 20 thousand visitors from Canada and Mexico respectively.
Thank you for your help!
THE CHART SHOWS EXPECTED CITY VISITS BY COUNTRY OF ORIGIN FOR 2018 (THOUSAND/YEAR)
The given chart gives information about the travelling tendency to 4 countries of people in the USA, Canada and Mexico in the year 2018.
Overall, Marid is anticipated to be the most well-known tourist destination, on the contrary, the lowest figure belonged to Liverpool. It is also apparent that there will be a significant disparity in the number of travelers to the capital of France.
According to the current predictions, there will be numerous American visitors in Madrid(100 thousand), compared to the figure for Canadian and Mexican, with 80 thousand and nearly 70 thousand respectively. Similarly, the number of Americans having a trip to Liverpool is likely to stand at somewhere in the vicinity of 50 thousand, which is double and triple as much as the quantity of Canada and Mexico.
Looking at the graph more detail, the year 2008 is estimated to witness an equal number of citizens in these 3 countries travelling to Paris (above 600 thousand). Meanwhile, the figure for Rome is predicted to have the biggest difference among 3 nations, to be specific, there will be approximately 80 thousand American residents compared with just 50 thousand and 20 thousand visitors from Canada and Mexico respectively.
Thank you for your help!

BURH.jpg
