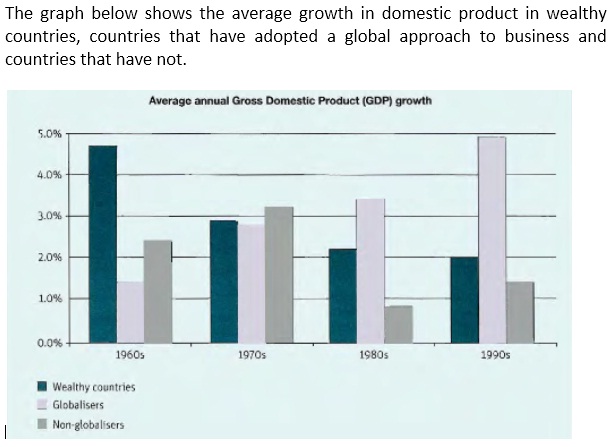
The bar chart reveals the mean growth of Gross Domestic Product (GDP) of three types of countries; wealthy countries, globaliser countries, and non-globaliser countries; from 1960s to 1990s. It is measured in percentage. Overall, it can be seen that, despite some fluctuations in non-globaliser countries, the average of GDP of wealthy countries decreased while the globaliser countries increased.
In 1960s, the average of GDP in wealthy countries stood at about 4.7%. Next decade, it dropped sharply to around 2.9% and then fell gradually to approximately 2.2% in 1980's and 2.0% in 1990s. A decrease of mean GDP of about 2.5% was experienced by wealthy countries during the period.
On the contrary, the mean of GDP in globaliser countries was only about 1.3% in 1960s and then rose significantly every decades. It was nearly 2.8% in 1970s, 3.4% in 1980s, and 4.9% in the last time, a dramatic rise of around 3.6% between 1960s and 1990s.
Finally, in non-globaliser countries, the mean of GDP fluctuated during the time frame. Moreover, it peaked at about 3.2% in 1970s and reached a low of nearly 0.8% in 1980s.

Writing_Task_1_Aver.jpg
