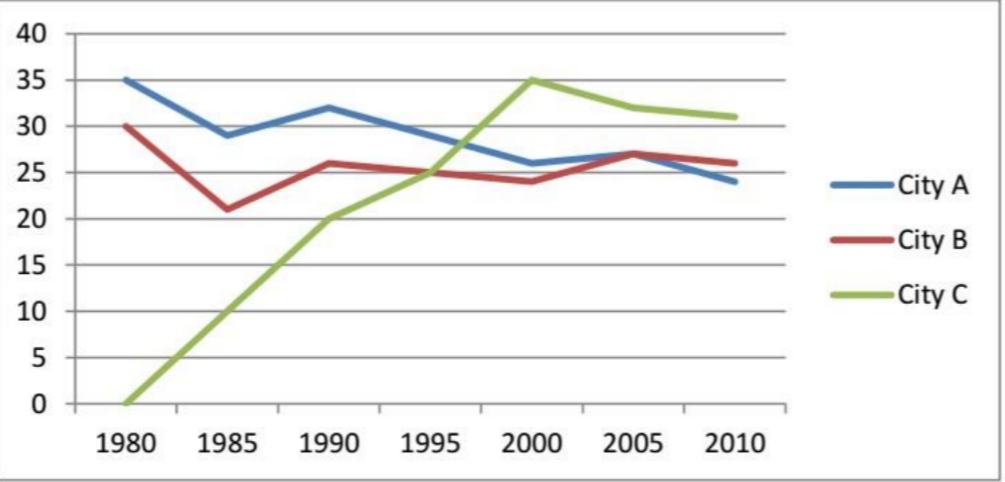
the number of conferences hosted in some capital cities
Topic: The graph shows the information about international conferences in 3 capital cities in 1980-2010. Summarize the information and make comparisons where relevant.
The line graph illustrates the data in three capital cities in terms of the number of international conferences during the period of 1980-2010
Overall, the number of such conferences in city A and city B dropped over the years, while the figures of city C witnessed the opposite until 2000.
In 1980, there were 35 and 30 conferences in city A and city B respectively. After 5 years the difference in figures was approximately 7 conferences and both experienced a minor increase in 1990. Between 1980 and 1990, the number of international conferences in city C rose substantially from zero to 20 conferences. This number continued to climb and met the figure of city B at 25 in 1995.
More conferences were hosted in city C after 1995, while in city A and B fewer took place. The number of conferences in these two cities when through some fluctuations whereas the figure of city C peaked at 35 in 2000. After 2005 the data of all three cities followed the downward trend.

20190724_204420.jpg
