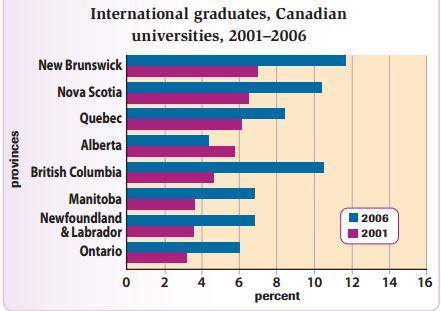
The International graduated students in Canadian Universities are revealed by the bar chart and it is differentiated by some Canadian provinces between 2001 and 2006. The chart had seen significant changes in all categories in 2006 with New Brunswick as the highest level. However, only Alberta had fallen almost 2 points.
By the 2001's, New Brunswick had a position at 7, but the next period saw the extremely climb almost 12. The second place had been obtained by New Scotia and British Columbia. Nevertheless, only British Columbia had shown significant changes by 6 points. However, the only decrease had experienced by Alberta, roughly 6 points in 2001 and 4 in 2006. Then, Manitoba, and New Foundland and Labrador had indicated the same trend over the period.
Overall, the International graduates in some Canadian Universities came from New Brunswick presenting the most noticeable changes, while Alberta showed the different trend. This chart illustrates that more student had graduated from Canadian University from 2001 to 2006.

graph_for_essay_foru.jpg
