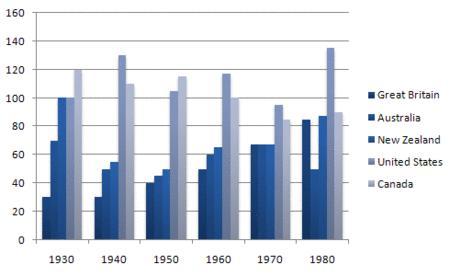
The chart gives evidence regarding a comparison of imprisonment level in five major nations around the world over a 50-year period from 1930 to 1980.
Overall, the figures of imprisonment level varied considerably one another. However, USA recorded the top notch level rate out of the five countries during statistic period.
Turning to the details, appearing by 100 thousand prisoners in 1930, the number of prisoner in USA was slightly fluctuated from 1940 to 1970. However, these figures recovered slightly to approximately 140 prisoners for four decades following. Evidently, statistic for Australia and New Zealand also experienced a period of fluctuation with a gradual drop in the first half then it continued a slight increase in second half period.
A more detailed look at the graph compares that the imprisonment level in Canada and Great Britain was not always steady. In 1930, the number of prisoner in Britain recorded by 25 thousands, since then the figures have experienced a gradual increase to 83 thousand in the end of period. Standing in contrast with the former, Canada experienced a fluctuation in their imprisonment level. While, these figures felt slightly from 120 thousands in 1930 to around 114 thousand a decade later, it was a slight recovery before plummeted gradually to less than 100 thousands in the last half period.
Interestingly, there are 2 similar number of imprisonment shown, in 1930 and 1970, which are included different numbers of countries.

Improsiner_rate_of_c.jpg
