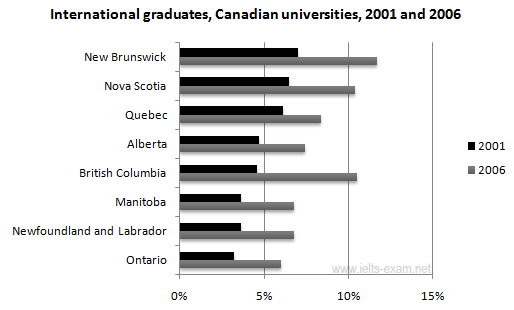
The chart below shows the percentage change in the share of international students among university graduates in different Canadian provinces between 2001 and 2006.
Summarise the information by selecting and reporting the main features, and make comparisons where relevant.
Write at least 150 words.
The bar chart compares the proportion change in share of international student who graduate from university in different Canadian provinces in 5 period. It is measured in percent. Overall, over periode 5 years, it can be seen that, the proportion change of international collage always changed uneven across in province of Canada. Although, New Brunswink remained the highest percentage in 2001 and 2006.
By 2001, the percentage share in Ontario only 3%. Same as Manitoba, the proportion Newfoundland and Labrador were 4%, folowed by British Columbia and Albarta, about 4.5%. Quebec in 6% and Nova Scotia 6.5. The highest proportion was New Brunswick with 7%.
By 2006, all of Canadian's province increase in their share of international graduates. Especially in New Brunswick, where the figure rose from7% to 12%. British Columbia in the highest position, where it more than doubled to 11%.

IELTS_Writing_Task_1.png
