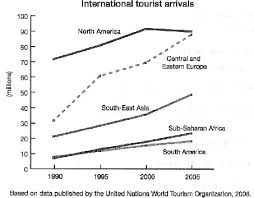
The graph provides information regarding the number of international tourist arrivals around parts of the world throughout the whole periods in question. Overall, the most striking point from the graph is North America and Central and Eastern Europe as the majority of international visitors over the timeframe. Whereas, the figure of South-East Asia's foreigner travelers doubled an increase, another did not experience a significant change as the whole of the period in the graph.
According to graph, North America started as the highest number of people visiting amongst others. Their number stood at over 70 million visitors in 1990, and then experienced a gradual fall by approximately 3 million travelers, after the trend peaked at 90 million individuals travelling in their countries in 2000. Following this, there was a dramatic rise in the figure of Central and Eastern Europe over the period in the question from 30 million in the first year to at just under 90 million tourists at the end of the period.
Moving to a more detailed analysis form the chart reveals that Sub-Saharan Africa and South America had a similar point of foreigner visitors. Between 1990 and 2000, their figure had virtually pattern, but in 2005 for Sub-Saharan Africa, they had number travelers more than South America's figure at around 22 and 18 million visitors respectively. However, South-East Asia could be considered as the figure who witnessed a significant growth from juts 20 million to nearly 50 million foreigners visiting in the last year in the question.

International_touris.jpg
