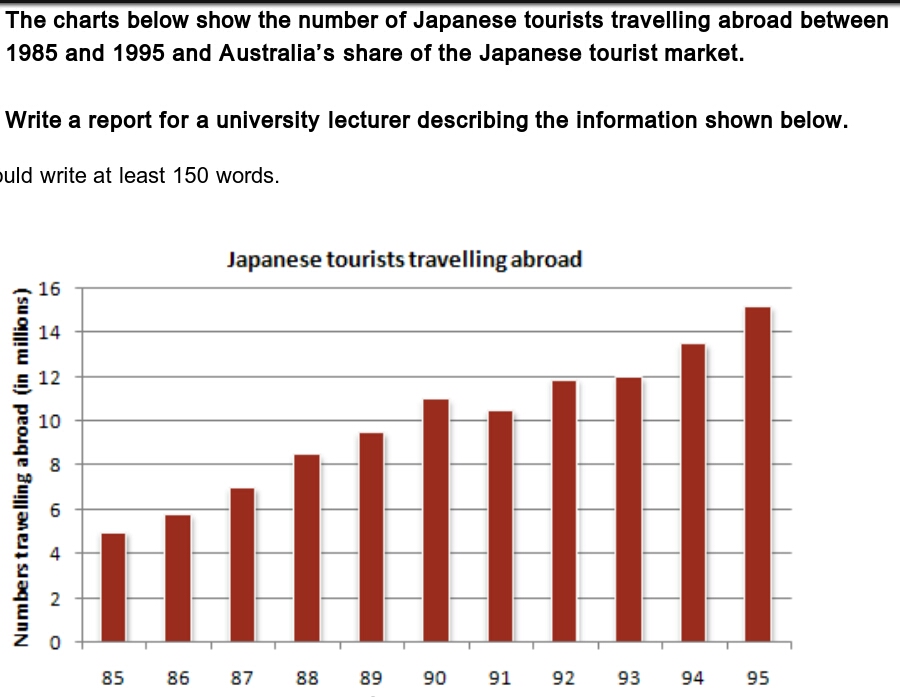
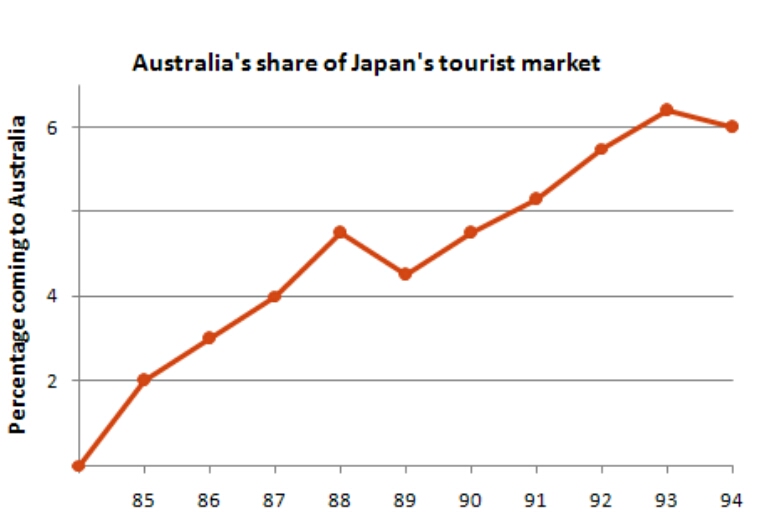
The bar chart compares the number of Japanese visitors travelling abroad in a 10 year period, while the given line graph illustrates the information about Australia's share of marketing for Japan tourists.
It is clear that the highest number of Japanese tourists went to abroad in 1995, while just more than 6 % of them travelled to Australia in 1994.
According to the graph that just less than 5 million Japanese tourists travelled to abroad in the first period. This trend increased steadily from 5 million in 1985 to 15 million in 1995. However, in 1991, the number of Japanese tourists had decreased from 11 million to about 10 million.
The percentage of Japanese tourists increased sharply and reached more than 6 % who visited to Australia between 1885 and 1994. While in 1989, it decreased to just over 4 percent, the following 5 years the percentage of tourists showed an increasing in the Australia's share of marketing for Japanese.

PicsArt_139568180506.jpg
PicsArt_139568182765.jpg
