Unanswered [1]
  

Home / Writing Feedback   % width   Posts: 6


The levels of unemployment among young people between 1993 and 2012 in England


LAKHANH 1 / 2  
Aug 2, 2018   #1

the percentage of unemployed people in UK


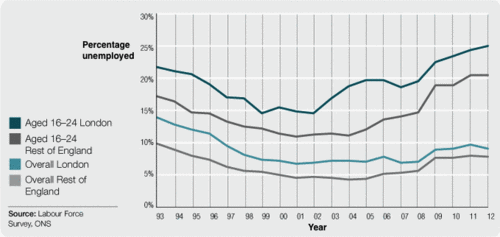
The line graph compares levels of unemployment among 16 to 24-years-olds with overall unemployment figures from 1993 to 2012 in England.

Overall, the unemployment ratio was significantly higher for the youth than for the general adults in both london and the rest of England during the 20-year period. And the joblessness in London are more popular than that in the rest of the UK.

In 1993, around 22% of young adults in London were unemployed, after falling to under 15% in 2002, this figure then increased significantly and reached a peak at exactly 25% by 2012. In contrast, there was a decline in the overall unemployment ratio in London from under 15% in 1993 to just about 7% in 2006, although after that this figure rose slightly, it just remained under 10% in 2012.

Similarly, in 1993, the percentage of unemployment among young Labour in the rest of England was approximately 17% , after decreasing to about 11% in 2002, this figure then rose dramatically and by 2012, it peaked at over 20%. Otherwise, there was an downward trend in the general joblessness rate in outer London from exactly 10% in 1993 to just under 5% in 2005, despite minor growths it still remained below 10% by 2012.

  • The graph below shows changes in young adult unemployment rates in England between 1993 and 2012.


trangtrang96 2 / 3  
Aug 2, 2018   #2
Hi @LAKHANH,
Please check your grammar, expression and vocabulary misktakes as follow:
1. london -> London
2. joblessness -> unemployment (it is quite unusual to use joblessness, mine is more common)
3. And the joblessness in London are more ... -> replace are with is (it is singular)
4. minor growths
5. minor growths it still remained ... -> it's a grammar mistake but I don't really what you mean so I can't correct it.

These are the mistakes that I have found, I am learning for the Ielts too so correct me if I'm wrong.
Holt  Educational Consultant - / 15461  
Aug 3, 2018   #3
La, your summary overview is not as complete as it should be. You neglected to inform the reader about The source of the survey and also the company that took the survey. Remember this simple rule so that you do not miss out on presenting important information in the essay summary, if it is in the graph or noted on the page of the image, you MUST mention it in order to show an accurate summary of information to the examiner. Miss out on some information and you will receive a lower TA scoring consideration because you did not completely list the information you were given.

The rest of your presentation paragraphs are well developed. However, you tend to write in run-on sentences. A common mistake among beginners writing these analysis reports. Try to write separate sentences for each information presentation. Learn to cluster related information into a single sentence, starting a new sentence for each cluster. You can write up to 5 cluster sentences per paragraph for this 4 paragraph format essay. Clustering the information helps you to ease the confusion of the reader and also, allows you to create a more coherent and cohesive paragraph presentation.
OP LAKHANH 1 / 2  
Aug 3, 2018   #4
@trangtrang96
Thanks a lot for your comment and advice. ❤ To be honest, I'm really struggling with writing :(, i took ielts exam 4 times.... And my writing skill was still at 5.5 =.='

@Holt
I really appreciate your help. Thank you so much for your comment and advice. ❤ To be honest, I'm really bad at writing, i always feel so confused and I don't know how to start and how to write a correctly sentence . Can u show me how to write summary overview correctly?
Holt  Educational Consultant - / 15461  
Aug 4, 2018   #5
Hi La. I asked for permission and was granted an opportunity to show you an example of a properly written summary overview. Here is the sample that you can use as a template for your future summaries:

A line graph has been presented for a comparison analysis. The subject of the graph is the measurement of the unemployed among the young workforce located in London and the rest of England. The survey studies the successive years of 1990- 2011 and was based on the age range of 16-24 for young adults. The graph used the percentage format for its measurement results as collated from combined surveys from the Labour Force, various surveys, and ONS. The graph shows an increasing trend in the young adults employed in London and England overall.

Now, what I am showing you is an example of how I would write this overview summary. This does not mean that you should always approach the presentation in this manner. All I want you to do is take note of the information that I presented in a clustered manner in the paragraph. All of these information are quick representations of the overall required data for the summary. Look for the highlighted and italics written information in the image presentation. Those are normally the required data for the summary.
OP LAKHANH 1 / 2  
Aug 4, 2018   #6
Hi Holt. Thanks a lot for your help. I extremely appreciate your enthusiasm. 😊❤ I'm going to note it down and practice it.

I wish you have a nice day. 🌞


Home / Writing Feedback / The levels of unemployment among young people between 1993 and 2012 in England
ⓘ Need Writing or Editing Help?
Fill out one of these forms for professional help:

Best Writing Service:
CustomPapers form ◳

Graduate Writing / Editing:
GraduateWriter form ◳

Excellence in Editing:
Rose Editing ◳

AI-Paper Rewriting:
Robot Rewrite ◳