Unanswered [0]
  

Home / Writing Feedback   % width   Posts: 3


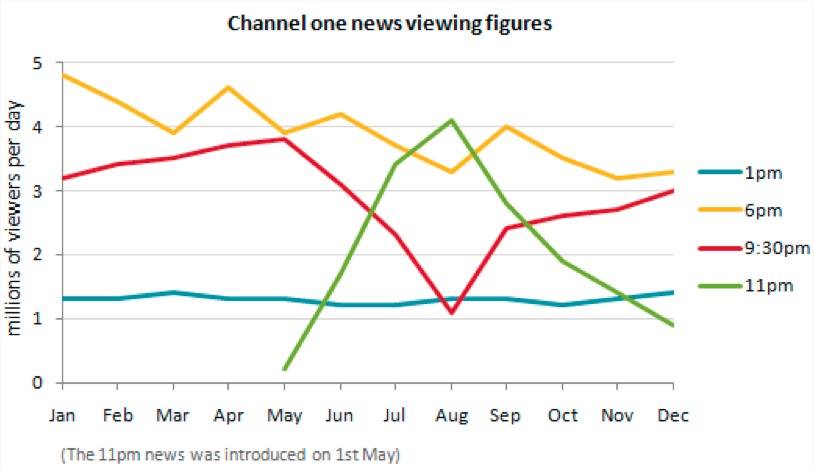
The line chart illustrates the number of viewers for channel one news during 12 months.


syamsiahRahim 9 / 15  
Apr 1, 2017   #1

channel one news popularity


The line chart illustrates the number of viewers for channel one news during 12 months. Overall, the most noticeable changes is seen in the average of viewer in August. Moreover, during one year all of features have different experiences.

There are 3 programs at the beginning of the 12-month period, 6 pm news stand at around 5 million and it becomes the highest number of viewers. Moreover, it decreases slightly in the end of period. Likewise, 9.30 pm news programs also go down in the last period. Meanwhile, the 1 pm news programs maintained stable over the period, it accounted for around 1.5 million.

A more detailed look at the chart reveals that the features experienced the additional news program. In May, The 11 pm news was introduced. In August, it reached a peak at 4 million viewers even though the other program like 9.30 pm news hit a low of 1 million viewers in the same month.

  • News.jpg


Holt  Educational Consultant - / 15467  
Apr 2, 2017   #2
Syiamsiah, the best way to have analyzed this line graph would have been on a quarterly treating basis. By grouping the time slots with similar audience viewership numbers, a more accurate comparison would have been reached. Note that the ratings information was provided on a monthly basis so the similarities and over lapping viewer information for various slots could have been better represented as well. As such, you would've offered the reader a better assessment of the time to watch the news. You should've also led into the second paragraph with information regarding the launch of the 11 p.m. news broadcast in order to create a more chronological representation of the time slots. Given the time frame with which you have to analyze the graph, draft the essay and proof read your work, at least 10 minutes should be allotted for the first half of the task. The finalization should come only after you are sure that you have completely represented all of the possibly required information in the essay. Be proud in the knowledge that even though the essay has room for improvement, your work can score around a 5 at the most.
agus_mono 13 / 23  
Apr 2, 2017   #3
hay syamsiahRahim
i have read your essay, in the beginning paragraph, your introduction is too similar with the question. if you want to improve your score, you suppose to paraphrase well the question with your own language. your overview is too general and it did not coverage your paragraph 2 and three. turning to the second paragraph, you have to narrow down the programs, you may say there are three news programs. there is misinterpret data, for example: .... 9.30 pm news programs also go down in the last period, i think the go down trend is its viewers. i think you have mention it in the first paragraph.


Home / Writing Feedback / The line chart illustrates the number of viewers for channel one news during 12 months.
ⓘ Need Writing or Editing Help?
Fill out one of these forms for professional help:

Best Writing Service:
CustomPapers form ◳

Graduate Writing / Editing:
GraduateWriter form ◳

Excellence in Editing:
Rose Editing ◳

AI-Paper Rewriting:
Robot Rewrite ◳