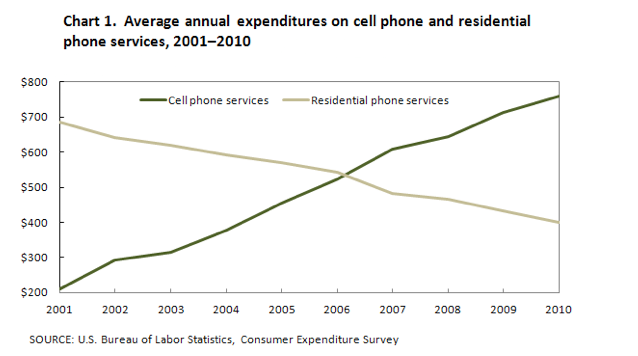
The graph below shows US consumers' average annual expenditures on cell phone and residential phone services between 2001 and 2010.
-------------------------------------------------------------------------------------------------------------------------------------------- -----------------------------------------------
The line graph illustrates the average yearly the costumer spending by American on mobile and landline phone services over the 10-year period.
It is clear that spending on landline services have a dramatic decline, while on mobile services increase slightly at a decade. However, both of services broke at the same record in 2006.
In 2001, on mobile phone services began by merely $200, while the greatest amount of annual expenditure was reached by the residential phone services around $700. Over the following 5 years, on cell phone services steadily dropped at just over $600, whereas on landline phone services were the reserve figure.
A closer look at the data reveals that on both types of phone service had paid out the same amount of money spending just over $500 by Americans in 2006. Exceeding, on mobile phone services rose by approximately $750 in 2010, but an average on residential phone services recorded a significant fall which was just over half this amount.

phone_services.png
