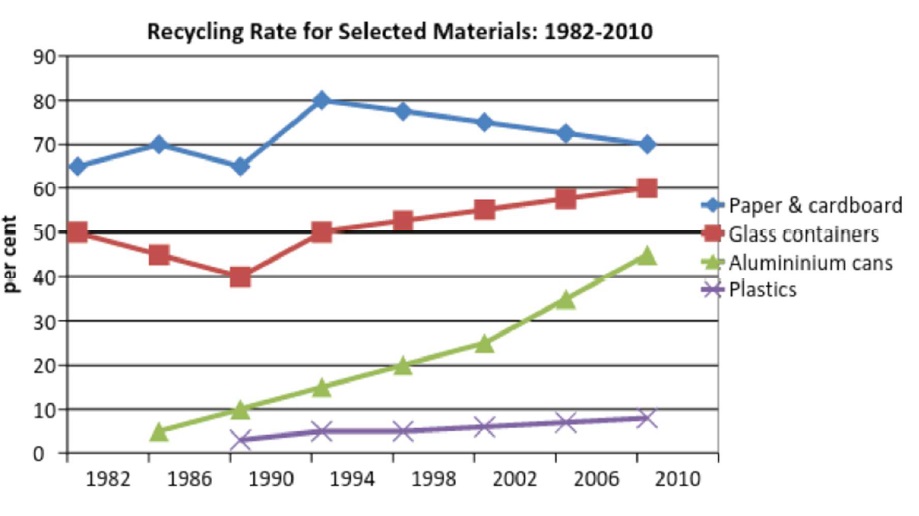
the percentage of recycled materials from 1982 to 2010
The line graph illustrates the percentage of paper and cardboard, glass containers, aluminium cans and plastics recycled during a 28 years period: from 1982 to 2010 in a country. Among four types of material, paper and cardboard were recycled the most. However, since 1994 the recycling rate for this material experienced a downward trend while those of other materials were generally upward.
In the upward trend group, the recycling rate of aluminium cans increased most steeply from only about 5% in 1986 to 45% in 2010. Meanwhile, the proportion of plastic recycled rose at a much slower pace from around 3% in 1990 to approximately 8% in 2010. The rate of glass containers recycled experienced a drop in the first eight years (from 1982 to 1990) from 50% to 40% but the figure then bounced back again in 1994 to its original point. The upward trend continued until the recycling rate reached 60% in 2010.
The percentage of paper and cardboard recycled went up erratically from 65% in 1982 to 80% in 1994 but then it felt moderately to 70% in 2010.

Screenshot2.jpg
