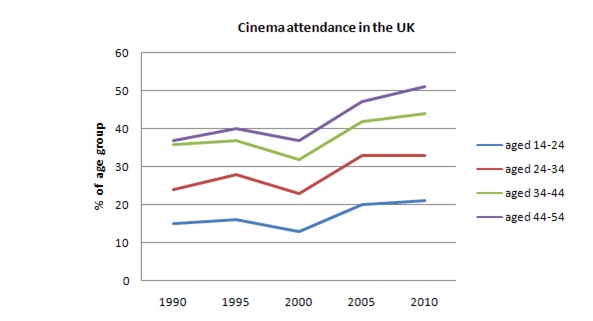
The line graph below gives information on cinema attendance in the UK.
A breakdown of the proportion of cinema attendance in the UK in four different age cohorts from 1990 to 2010 is illustrated in the line graph. Overall, more peope aged 14 to 54 went to cinema,while people in age group 14 to 24 did not enjoy going to cinema. All figures witnessed upward trends.
Initially, in 1990, cinema was by far the favorite for 44 to 54 age group and people aged 34 to 44, with nearly 40 % . Meanwhile, fewer people aged 14 to 24 enjoyed to go to cinema, accounting for 15 %. Another figure saw just over 20 %. By 2010, all figures had witnessed a rise. A gap between people in age group 44 to 54 and 34 to 44 had widened out. The former accounted for above 50% and the latter amounted to just over 40 %. Others had seen stable from 2005 to 2010 and they had reached 32% and 20% for 24-34 and 14-24 brackets.
Between 1995 and 2000, all figures saw a drop. The proportion of people in age groups 44 to 54 and 34 to 44 was a hit lof of around below 50% and this was followed a continous and steady increase. Those of people aged 24 to 34 was 22 %, while 12 % of people aged 14 to 24 attended the cinema.

group.png
