Unanswered [1]
  

Home / Writing Feedback   % width   Posts: 3


Ielts writing task 1: The line graph illustrates fluctuations in China's and the US birth rates


Phamthihaiha 2 / 3  
Aug 24, 2020   #1

The Analysis of Birth Statistics


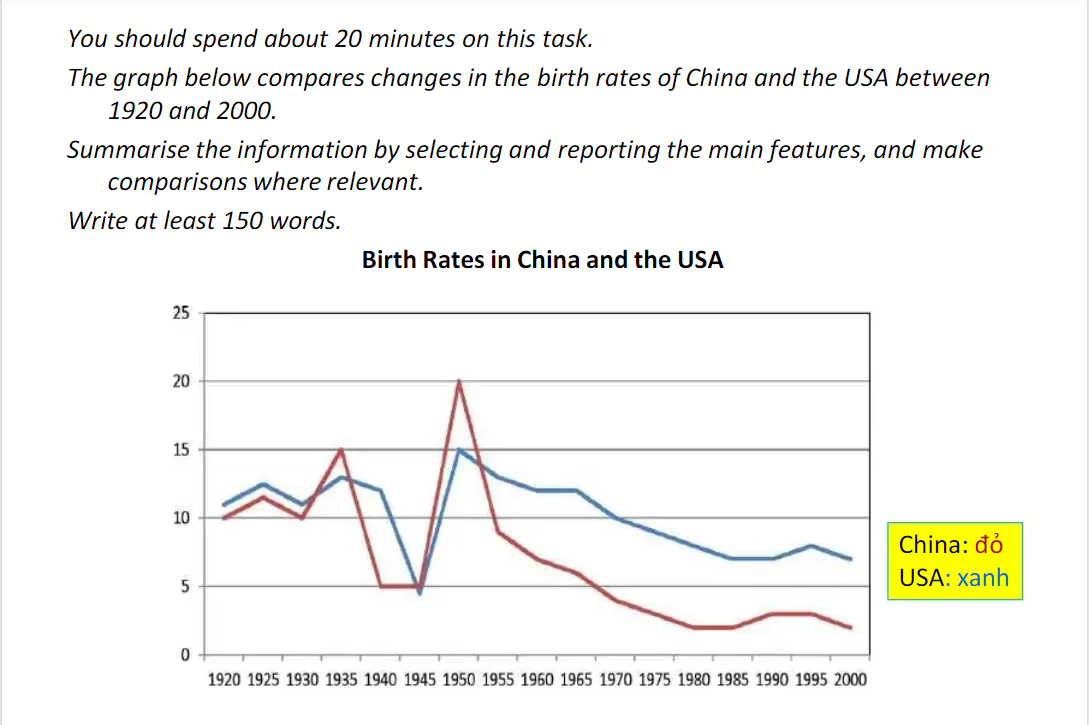
The line graph illustrates fluctuations in China's and the US birth rates from 1920 to 2000.
As can be seen from the chart, both the USA and China experienced a global downward trend by varying degrees in the birth rates. However, the birth rate of the USA in most years was higher than that of China.

The birth rates in the US fluctuated around 12% in the 1920-1935 period before decreasing dramatically to below 5% in 1945. In contrast, there was a sharp increase to exactly 15% in 1950, which was its highest point during the 80-year period, followed by a gradual decrease to 7% in the last year in the birth rate of the US.

Over the same period, the birth rate in China varied more significantly than in the US. After witnessing volatility in the first 15 years, the birth rate of China fell substantially by 10% in 1940, after which the period until 1945 unchanged. On the other hand, it grew steeply by 15% to reach a peak of 20% in 1950, compared with a rapid decline of approximately 20% from 1950 onwards.

  • task1trend..png


Holt  Educational Consultant - / 15466  
Aug 25, 2020   #2
You accidentally created a run-on sentence int he second paragraph. The sentence after the first one, which was separated only by commas, should have been separate into one comma presentation, a period, then a new sentence so the format would have been ------------.--------, -------------.-----------. The diagram indicates a 3 sentence, rather than a 2 sentence presentation for that part. By the way, in the 3rd paragraph, it would be better if you did not say , "On the other hand" if you did not previously indicate "On the one hand". The phrase loses its significant comparative meaning of the word pairing is not properly used.

Good work using the 3 paragraph format. You properly grouped the discussion, creating a clarity in your presentation that would definitely boost the C&C score of your presentation. The discussion is clear, the information are related within the USA and China comparative context, and all the comparison information was formally presented to the reader. It shows that you clearly focused on the proper analysis and presentation of information as required by the discussion requirements.
jacky99 3 / 5  
Aug 25, 2020   #3
1. Not like @ Holt feedback, I suppose that you use the structure of 4 paragraphs because I have been read lots of format like this. However, you should try to put the overview and introduction in one paragraph, make your presentation in 3 paragraphs only.

2. In your first sentence or the introduction, you need to pharaphase the topic in tandem with don't use the world to demonstrate the trend in first sentence.

3. Use some word to illustrate the opposite of figure such as in contrast, meanwhile... don' use "on the one hand" like @ Holt feedback
4. Because the figures are not accurately, thus, need more concentrate on some words illustrate the uncertain figure such as approximately, in the vicinity of, roughly...

5. Need to paraphrase the word "birth rate" => birth proportion, birth ratio...


Home / Writing Feedback / Ielts writing task 1: The line graph illustrates fluctuations in China's and the US birth rates
ⓘ Need Writing or Editing Help?
Fill out one of these forms for professional help:

Best Writing Service:
CustomPapers form ◳

Graduate Writing / Editing:
GraduateWriter form ◳

Excellence in Editing:
Rose Editing ◳

AI-Paper Rewriting:
Robot Rewrite ◳