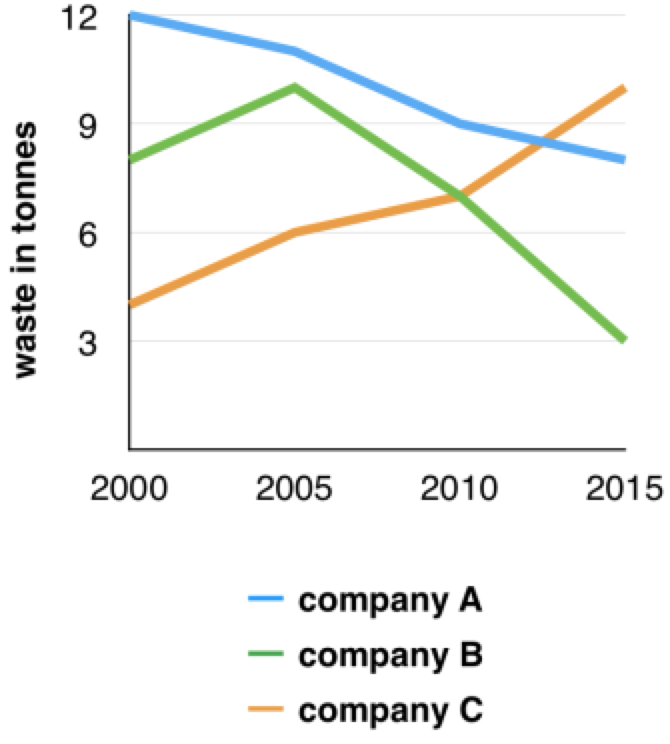
the amounts of waste produced by 3 companies in last 15 years
The line graph below illustrates how much waste was generated per year by three different companies between 2000 and 2015. Overall, companies A and B produced less and less waste and company C produced more and more during this period.
Company A generated 12 tonnes of waste in 2000 and the weight decreased to about 11 tonnes in 2005. 5 years later in 2010, it dropped to 9 tonnes. The tendency continued between 2010 and 2015 with the amount of waste going down to less than 9 tonnes. Around 8 tonnes of waste was generated by company B and the number increased to about 10 tonnes in 2005, then decreasing to around 7 tonnes, in the end dropping to 3 tonnes in 2015.
Different from company A and B, company C produced more and more waster in a year. In 2000, only about 4 tonnes of waste was generated. It went up to 6 tonnes in 2005, later rising to about 7 tonnes, ending up with around 10 tonnes in 2015.

ScreenShot202002.png
