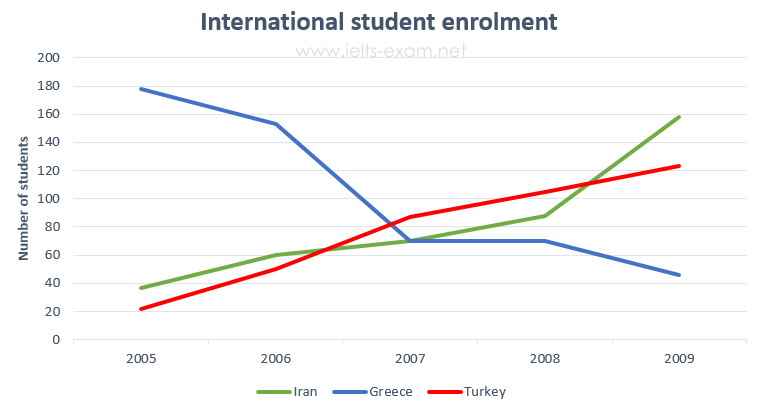
The line graph gives information about the number of Iranian, Greek and Turkish students who enrolled at Sheffield University between 2005 and 2009.
The line graph depicts the enrolment rate of students from three distinct countries at Sheffield University from 2005 to 2009.
Overall, the figure for Iranian and Turkish scholars applying to the university saw an upward trend. In contrast, the number of those from Greece experienced an inverse tendency at the same time.
Initially, the figures for Iran and Turkey were relatively the same, with a difference of merely 20 students. More than a year later, the number of enrolling students from Turkey surpassed that of Iran, after which the former experienced a much deeper surge than the latter did. The following years witnessed a steady growth in both figures, in addition to a significant increase of more than 50 in the number of Iranian students in 2008. Consequently, Iran and Turkey hit their peaks at 160 and 120, respectively.
Meanwhile, starting at 180 students, the figure for Greek scholars was exceptionally higher than the rest; however, it then experienced a substantial downward trend by more than a half. After this, one-year stability was witnessed in 2007, followed by a noticeable fall in 2009 to less than a quarter, compared to the initial figure.

IELTS_Writing_Task_1.png
