Unanswered [1]
  

Home / Writing Feedback   % width   Posts: 2


Ielts task 1: Line graph - Oil consumption of four main consumers


kngocph 1 / -  
Sep 9, 2020   #1

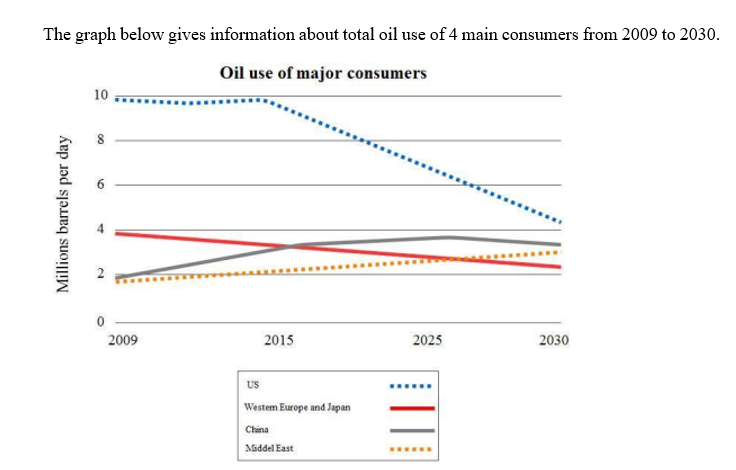
The line graph illustrates the total oil consumption of four different countries between 2009 and 2030.


As can be seen from the graph, Middle East and China are predicted to increase, while there will be an expected decrease in oil consumed by US and Western Europe/ Japan in 2030. The US will always remain a major consumer over the 20-year period.

In 2009, US citizens consumed 10 million barrels per day, more than five times the figures for China and Middle East. Started at 4 million barrels, Western Europe and Japan experienced a gradual fall to 3 barrels in 2015. While total oil consumption in China and Middle East rose slightly, that of US remained constant till 2015.

By 2030, the number of oil consumed in China and Middle East, despite some fluctuations, are expected to rise to 3 million barrels each. By contrast, Western and Japan will witness a gradual decrease to 2 million in total oil consumption. The most significant change is the expected figure for oil consumed in US, with a sharp fall from 10 million to more than 4 million in 2015 and 2030, respectively.

Thank you for helping me to review my writing! What score can I get from this essay?

  • Capture.PNG


Holt  Educational Consultant - / 15501  
Sep 10, 2020   #2
The reason you are being asked to deliver the image report is because the professional you are reporting to is assumed to not have a copy of the image. So you should not make a reference to having the reader check the image. The image, for all intents and purposes, will not be there. So the clarity of your report will be based on the written report / imaginative details that you provide for the reader's consideration

You forgot to mention how many millions of gallons China and the Middle East consumed. Although you mentioned the US would consume 5 times more, the measurements should be mentioned somehow. Guesstimates will be acceptable in this instance. You need to present figures to create a sense of accuracy in your graph analysis.

Unfortunately, the free review does not include scoring services. That is done only as a private review or URGENT thread. You don't have to worry though, save for a few errors, you should manage to score well in the actual test.


Home / Writing Feedback / Ielts task 1: Line graph - Oil consumption of four main consumers
ⓘ Need Writing or Editing Help?
Fill out one of these forms for professional help:

Best Writing Service:
CustomPapers form ◳

Graduate Writing / Editing:
GraduateWriter form ◳

Excellence in Editing:
Rose Editing ◳

AI-Paper Rewriting:
Robot Rewrite ◳