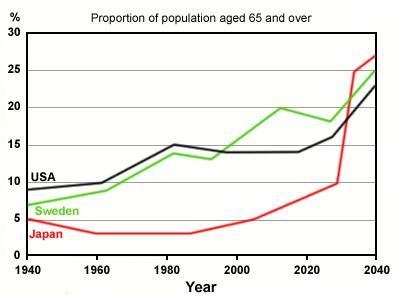
The line graph highlights the percentage of citizens aged 65 and over from 1940 to 2040 in three countries. In common, it is obviously seen that the proportion of elderly in Japan, USA, and Sweden will be upward during one century.
According to the data, Japan stood as the lowest percentage (5 %), though it was level down up to the next four decades. Next, the prediction is that it will gradually increase until 2030 even though it will be stable as the least trend. Surprisingly, the number of unproductive people in Japan is predicted enormous increase three times during a ten-year of periods and then becomes the highest data.
However, in 1940, USA began the greatest trend and experienced gradually increase, followed by Sweden which is almost equivalent. Interestingly, they had the same point in 2000, and then USA remained steady while Sweden experienced double. Equally important, both of them repeat similar tend in 2005. It is predicted that Sweden will be the second rate and USA to be the third.

12744613_12201709546.jpg
