Living alone in England by age and gender, 2011
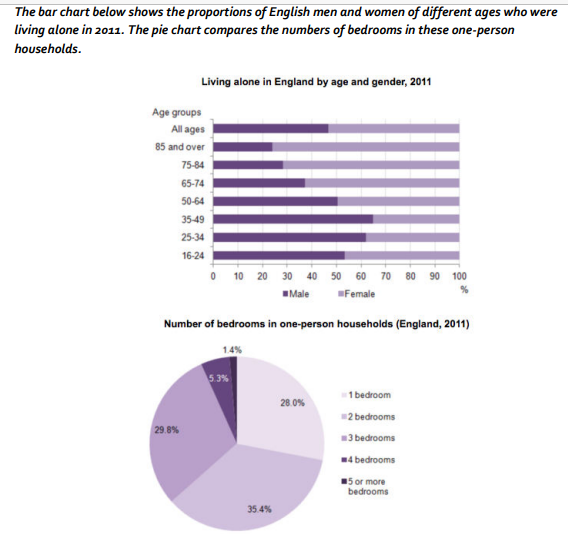
While bar chart indicates how Britain males and females in multiple ages lived independently in 2011, the pie chart compares the figure for bedrooms designed in one-person accommodation. Overall, the male youngsters prefer live solitarily, whereas this lifestyle is prioritized by the older female. Additionally, one-person households mainly own two bedrooms.
With regard to the bar chart, while the majority of men aged 35-49 live by themselves, at 65%, the highest percentage in women is the age group 85+, at 75%. Besides, a similar pattern between men and women was witnessed at the age of 50-64 and 16-24, with around 50% of individuals choosing alone lives. The male aged over 85 living on their own witnessed the lowest with 25%, however, the lowest proportion in female is surveyed by the 25-34, with roughly 40%.
Regarding the pie chart, the household with one bedroom accounts for the highest with 35%, followed by the two-bedroom and three-bedroom residences with 28%, 29.8% respectively. On the contrary, just 5.3% of one-person accommodation owns one bedroom, and there is a very small figure for the household possessing over 5 bedrooms, which is 1.4%.

Bar chart and Pie chart
