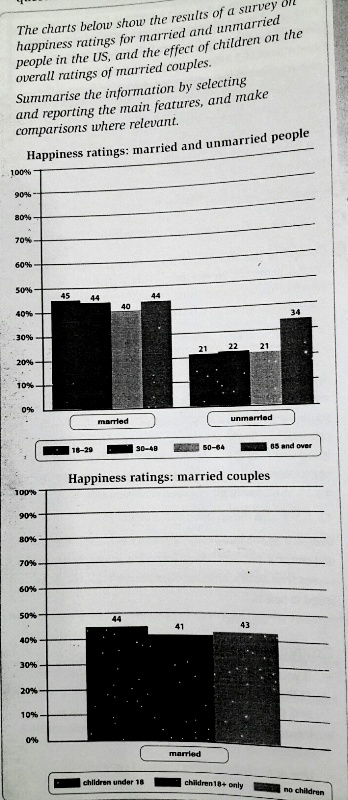
A survey of the happiness levels between single people and married couples, as well as having children's effect on families is displayed in the bar charts. Overall, it can be seen that the married couples have the happiness levels higher than the single people. In any case, the happiness levels for the married couples who have or do not have children almost witness the same percentages.
A closer look at how this chart illustrates difference of the happiness levels for married and unmarried groups. The 18-29 age group is the highest level at 45% in the couple category. Afterwards, there is the same levels of both 30-49 and more than 64 age groups in the married group. Likewise, the 50-64 age group in the category of married couples has the lowest happiness level at 40%. On the other hand, the unmarried people experience the levels of happiness at approximately 21% for three age groups except the 65 and over age group at 34%.
Apart from this, another chart describes happiness percentages for the married couples who have or do not have children. The largest percentage is parents who have the children aged under 18 at 44%. After that, the percentage of the married couples who have not a child follows at 43%. Finally, 41% of all couples witness the lowest happiness percentage of another age group.

married couples
