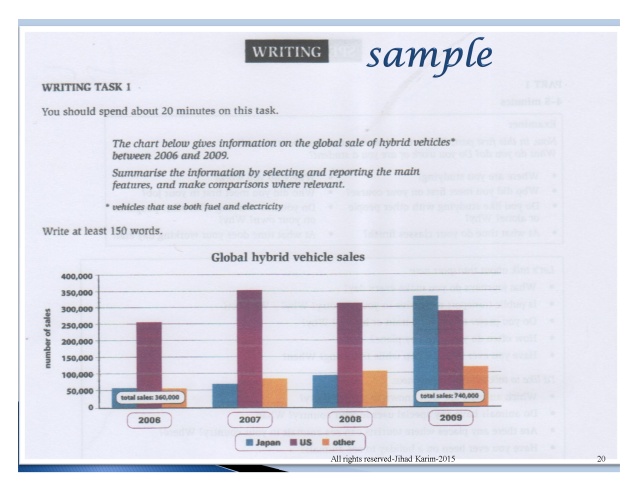
The bar chart shows information of the sale of hybrid vehicles around the world from 2006 to 2009, and it is measured by in the number of sales. Overall, it can be seen that US is the highest sales country over 3 over the first three years while in the last period japan dominated the global sales.
To begin, the number of transport sales stood at 250,000 in US in 2006, which was followed by that in japan and other in same number at around 50,000. Then, US saw a peak at 350,000 in 2007, but the sales of other countries increased minimally to around 10.000. Afterwards, 20008 saw a slight rise in japan and other, roughly 20.000 in each country. In opposite, there was a minimal decrease in US of approximately 40.000. At the end of the period, the sales in US also declined slightly to 290.000, but the other country and japan witnessed a sudden increase. Japan reached a peak at 270,000 in 2009 and the other also experienced minimal increase to around 15,000.
To begin, the number of transport sales stood at 250,000 in US in 2006, which was followed by that in japan and other in same number at around 50,000. Then, US saw a peak at 350,000 in 2007, but the sales of other countries increased minimally to around 10.000. Afterwards, 20008 saw a slight rise in japan and other, roughly 20.000 in each country. In opposite, there was a minimal decrease in US of approximately 40.000. At the end of the period, the sales in US also declined slightly to 290.000, but the other country and japan witnessed a sudden increase. Japan reached a peak at 270,000 in 2009 and the other also experienced minimal increase to around 15,000.

The_sale_of_hybrid_v.jpg
