Hi everyone, Im Patric from Indonesia, and I'm a newcomers in the IELTS test.
Therefore, I honestly need several input to improve my capacity, particularly in task 1 and task 2.
So, hereby my first writting. Feedbacks and criticism are very welcome. Thanks in advance
Questions:
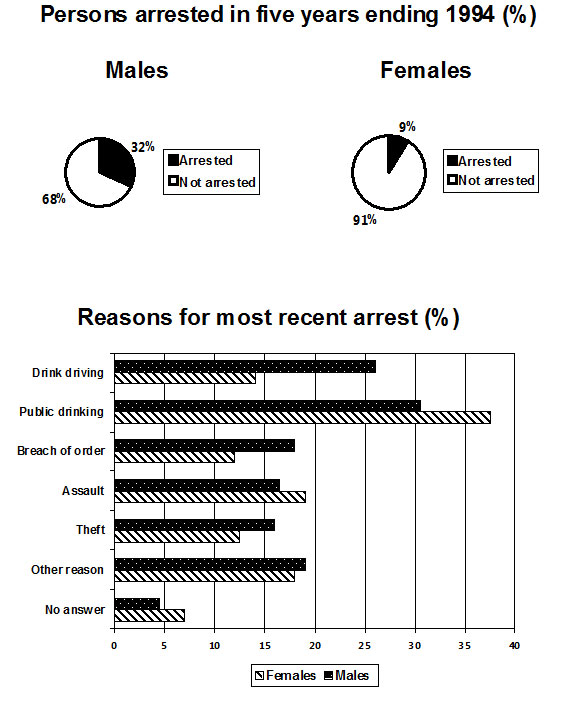
The pie chart shows the percentage of persons arrested in the five years ending 1994 and the bar chart shows the most recent reasons for arrest *
The represented graphs reveal the information about the haul of male and female in the last five years, ended in 1994.The pie charts show the comparison of haul for both sexes and the graph provides the several causes making it, afterwards. It is noticeable that males are the most frequently arrested and the prominent cause is public drinking.
At the beginning, it is clearly seen that almost a third of males was arrested compared to one in four of it by females. However, the level of uncaught of female was higher than male, 91% and 68%, respectively.
A closer look to the second graph, the reason in public drinking was considerably higher than others. It was particulary seen that females were the highest rate, at around 38% whereas the male is around 30% in a period of time. In reverse, male actually witnessed a significant difference by 27% contrast to 14% in drink driving reasons. As a matter of fact, the level of haul for other reasons such as breach of order, assault, and theft, were quite similar for both genders, whilst the least reason was no answer, led by female in 7%.

Mixed Chart
