Unanswered [2] | Urgent [0]
  

Home / Writing Feedback   % width   Posts: 2


IELTS Task 1 mixed with table and pie chart - people in Australia


dhcuber 1 / -  
Nov 30, 2019   #1

spectrum of australian society


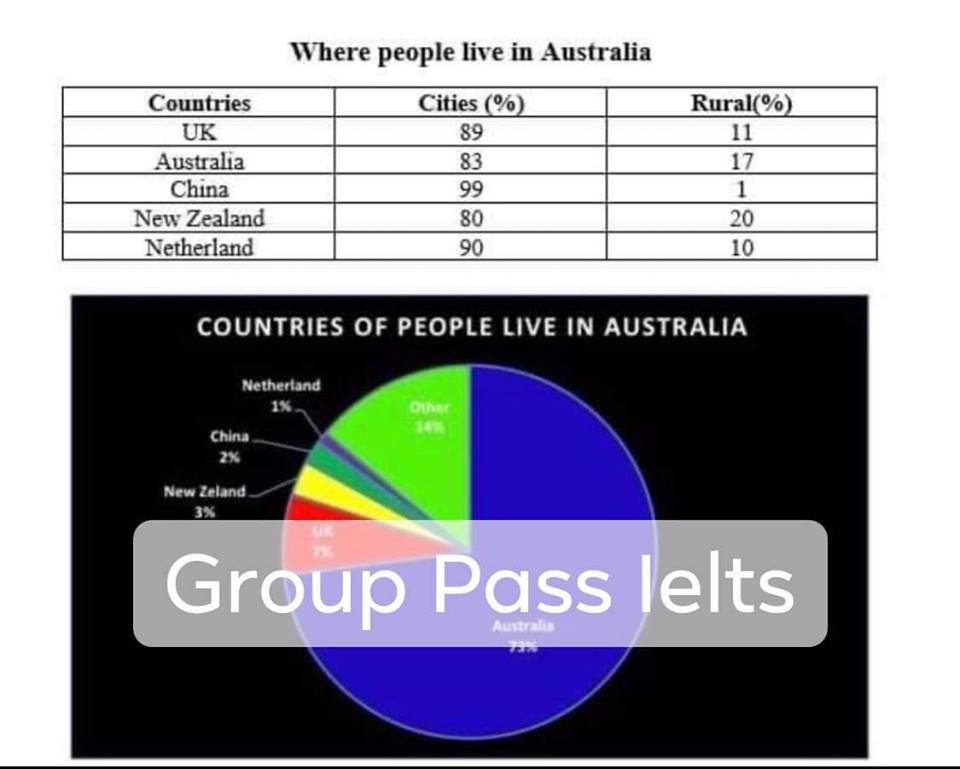
The first chart compares the percentage of accommodation in Australia from two different types of place in five nations namely UK, Australia, China, New Zealand and Netherland. The following chart provides data about birthplace of people who living in Australia.

Overall, it can be clearly seen that almost people who are living in Australia prefer to stay in cities rather than countryside. In addition, beside of Australian, English people accounted for a large proportion between five nations lived in Australia.

Regarding the table, from five countries, people who lived in cities are more than countryside. China has the highest difference in proportion of people who living in cities and rural with 99% and only 1%, respectively. After that, UK and Netherland have the second disparity in percentage with nearly 90% people lived in cities and only 10% lived in countryside. Australian and New Zealander have lower figures with 83% and 80% people lived in cities, respectively.

Meanwhile, beside of Australian, almost inhabitants lived in Australia are from UK and other nations with 7% and 14%, respectively. The percentage of people living in Australia in New Zealand and China is lower with 3% New Zealander and 2% Chinese. Hollander who lived in Australia have the lowest percentage with only 1%.

  • 78323346_51576163261.jpg


Maria - / 1096  
Dec 2, 2019   #2
@dhcuber
Hello, welcome to the forum! I hope that the feedback you receive from me somewhat helps you in your learning endeavors. Don't hesitate to approach again if you have any other questions.

When there are ways for you to make mention of certain parts of the text without necessarily needing to create baffling content, this would be a lot better for your writing in the long-run. Not only will this allow you to save space that can used more productively in latter parts of the essay, but it also teaches you to prioritize what information you are using here. In that regard, I think that the omission of unnecessary information, excessive descriptors, and repetitive lines would serve you well for the rest of the writing. If we take a look at what you currently have, the third paragraph could have been shrunk more to create something more straightforward. Try to stick with just the basic information before you even try to make an analysis, hence move the second paragraph to the very last portions of the text.


Home / Writing Feedback / IELTS Task 1 mixed with table and pie chart - people in Australia
Need Writing or Editing Help?
Fill out one of these forms:

Graduate Writing / Editing:
GraduateWriter form ◳

Best Essay Service:
CustomPapers form ◳

Excellence in Editing:
Rose Editing ◳

AI-Paper Rewriting:
Robot Rewrite ◳

Academic AI Writer:
Custom AI Writer ◳