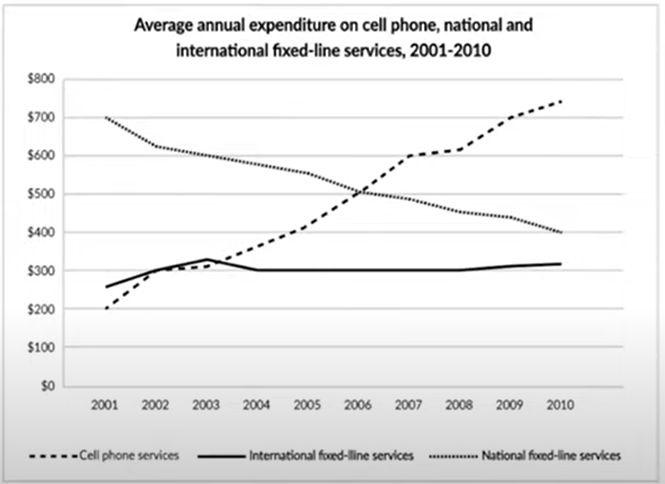
The line chart illustrates how much annual money was allocated to cell phone, national and international fixed-line and services in America over the period from 2001 and 2010.
Overall, while the amount of money spent on national fixed-line services saw a downward trend, the opposite was true for cell phone services. Also, cell phone services witnessed the highest money in the final period.
In 2001, the highest yearly money can be seen in national fixed-line services, with $700, in comparison with nearly $250 for international fixed-line services and $200 for cell phone services. Over the next five years, the money which was spent for national fixed-line service, however, saw a drop of nearly $200. The amount of money for the other two categories increased, with $500 for cell phone services and around $300 for international fixed-line services.
From the year 2006 onwards, there was a dramatic change between cell phone services and national fixed-line services. To be specific, the year 2010 witnessed a significant increase in the money for cell phone services, up to over $700. However, the amount of money for natinal fixed-line services inscrease to $300. In addition, during the period of the final years, the money for international fixed-line services fluctuated around $300.

Picture1.png
