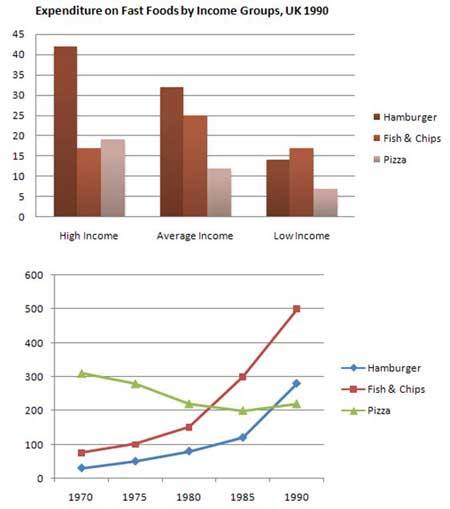
The chart below shows the amount of money per week spent on fast foods in Britain. The graph shows the trends in consumption of fast foods.
The presented data illustrates Britain money spend on fast food and the consumption of three kinds of fast food over two decades. It is clearly seen that high income people spend more money in fast food than two other income groups; Furthermore pizza was the only fast food showed an enormous decrease.
Based on the bar chart, 40 per cent per person of high income people spent their money on hamburger than two other fast foods which did not reach 20 per cent. People of average income also enjoyed hamburger with 32 per cent/person, followed by fish and chips 25 per cent and pizza nearly 13 per cent. The last, low income group was the lowest consumers of fast food, pizza was only 7 per cent per person in a week while hamburger was 16 per cent and fish and chips was 2 per cent lower than hamburger.
On the other hand, line graph presented UK consumption of fast food from 1970 to 1990. It showed that hamburger, fish, and chips rocketed significantly which in 1970 they were consumed no more than 100 grams, but by 1990 hamburger reached 500 grams and fish and chips were nearly 290 grams. In contrast, pizza was the most favourable fast food in 1970 with 300 grams, however over twenty years it had dip slightly about 100 grams by the end of 1990.

14639619_12993338567.jpg
