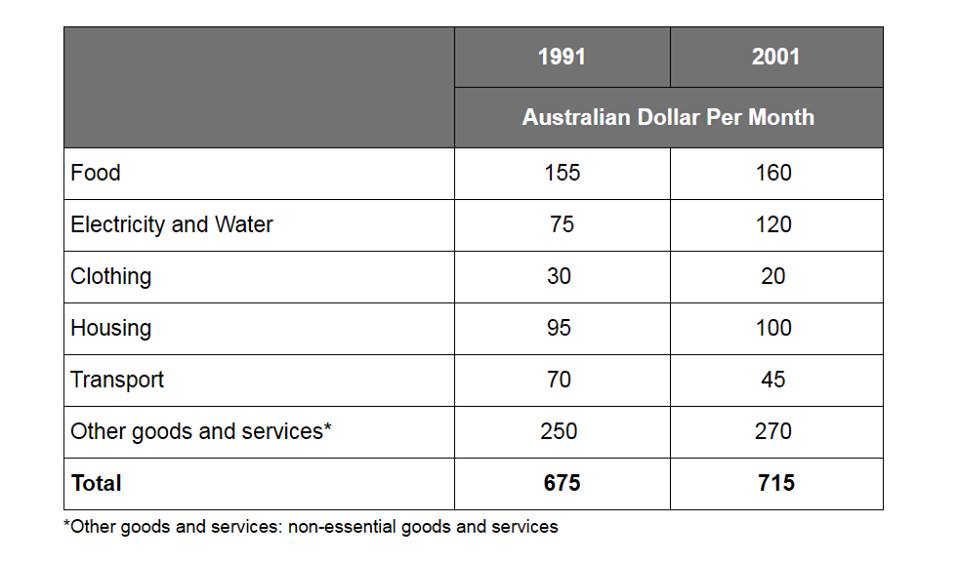
The given table illustrates the average expenditure of Australian household in dollar per month between 1991 and 2001. It is noticeable that the demand for non-essential goods and services was by far the greatest of the six types of requirements while the figure for clothing showed the least over the timeframe.
According to the data, the requirement for non-essential goods and services stood at 250 and increased to 270 in 2001, and predominated other necessities throughout the period. The number of food increased slightly and just over at 160, a 5-dollar rise in ten years. The necessity for housing followed the similar pattern, stood at 95 and rose to 100 after the following years. However, the electricity and water experienced a significant rise from 75 to 120 at the end of period.
On the contrary, the remaining requirements witnessed a decline trend. There was a sharp fall in the requirement for clothing, beginning the period at 30 and fall to 20 during the year 1991 to 2001. The necessity for transport saw a significant decrease, rom 70 to 45 at the remaining of time.

13177092_10204576015.jpg
