Unanswered [14] | Urgent [0]
  

Home / Writing Feedback   % width Posts: 4


motives of people applying for work / forms of transport used for journey - IELTS Task 1


vincentfreeman 7 / 20 2  
Oct 3, 2014   #1
This is my two writing task 1 essays. The graphs and the requirements has been given in the pictures attached

Exercise 1
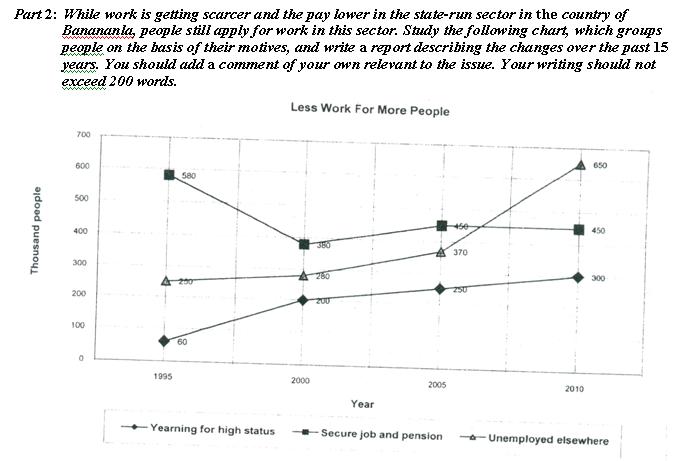
The chart shows the changes in the motives of people applying for work in Panamanla over a period of 15 years.
Overall, while there was a decrease in the number of people who seek pension and security in job, the number of others sectors experienced some enormous rise, especially in people with an aim for high status.

In 1995, secure job and pension was the most common motive , with 580000 people in this section, the number of people who yearned for high standard and were unemployed elsewhere were much lower, about one tenths and a half as much as those seeking pension and job security respectively. In the next five years, the gap between the three sectors was bridged, with a decrease of 200000 in the first mentioned sector, and increases in the others.

This gap remained unchanged till 2005 with a rise of around 70000 for each. After that, however, the statistic given for people who were unemployed elsewhere rocketed to 650000, occupied the highest position. Yearning for high status also increase slightly to 300000, being about three fourths of the pension and security job.

Exercise 2
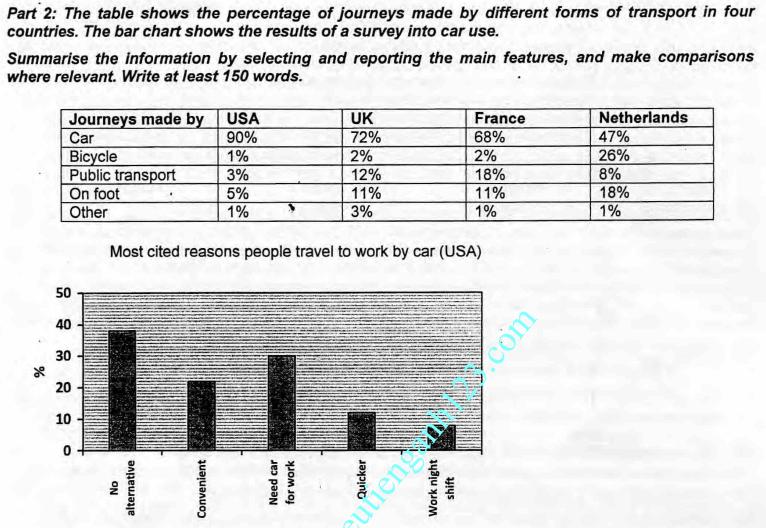
The table shows the proportion of 5 forms of transport used for yourney in the USA, UK as well as France and Netherlands. The bar chart present the reasons people travel to work by car in USA.

Overall, of the five transport forms considered, car dominates in all countries, especially in the USA, where the higest cuted reason for using car to work is no alternative. Netherlands seems to be the country with the most balanced uses of transportation for yourneys.

As can be seen in the table, the highest figure for car used is recorded in the USA, merely 90% in total. This form is also very popular compared others in UK, France and Netherlands, with 72%, 68% and 47% respectively. The gap between different forms of transport in Netherlands is smallest, with many people using environmentally friendly vehicles like bicycle and walking, about 26% and 18% severally.

In the bar chart, no alternative reason constitute 40%, 10% lower than that are those need car for work. Work night shift are least given as a ground, occupying only 10%.

  • Exercise 1

  • Exercise 2
sa1na 9 / 72 19  
Oct 3, 2014   #2
exercise 1 :

Overall, while there was a decrease in the number of people who seek pension and security in job, the number of others sectors experienced some enormous rise, especially in people with an aim for high status. the tenses do not make sense. You have some choices:

1. Overall, while according to the fraph, there is a decrese in the number of people seeking peoson and security in job, the other sectors experience some numerous rise, especially the sector where shows people aiming for higher status

2. Overal, while there has been a decrease in the number of people seeking pension and .. , the other sectors has experienced some enarmous rise, ..

secure job and pension waswere the most common motives

In the next five years, the gap between the three sectors was bridged, the same probelm as the first one:
1. has bridged
2. is bridged

This gap remained unchanged till 2005 again,
1. remains
2. has remaind

exercise 2 :
The bar chart also presents the reasons people

countries, especially in the USA,

work is no alternative - is the nonexistance of any other alternatives (you cannot use the graph lables in the writing. They are shorten than what they should be)

compared with others in UK, France and Netherlands, with

and walking - is walking a vehicle???
william731 18 / 43 13  
Oct 3, 2014   #3
Overall, while there was a decrease in the number of people who seek pension and security in job, the number of others sectors experienced some enormous rise

I think seek for "job and pension security" would be better to describe this category.
some enormous rises

In 1995, secure job and pension was the most common motive , with 580000 people in this section, the number of people who yearned for high standard and were unemployed elsewhere were much lower, about one tenths and a half as much as those seeking pension and job security respectively.

secure job and pension factor was the
using 580 thousands would be better.
one tenth
Finally, where is your conclusion?

The table shows the proportion of 5 forms of transport used for yourney in the USA, UK as well as France and Netherlands. The bar chart present the reasons people travel to work by car in USA.

journey?
presents
the reasons why people travel..

where the higest cuted reason for using car to work is no alternative

cute is an adj. there is no need to add "d"

his form is also very popular compared others in UK, France and Netherlands, with 72%, 68% and 47% respectively

compared with

Again , where is the conclusion ?
OP vincentfreeman 7 / 20 2  
Oct 3, 2014   #4
Thanks you bros! I think that before writing two detailed paragraphs, I have mentioned an overall trend as an alternative to the conclusion


Home / Writing Feedback / motives of people applying for work / forms of transport used for journey - IELTS Task 1
Writing
Editing Help?
Fill in one of the forms below to get professional help with your assignments:

Graduate Writing / Editing:
GraduateWriter form ◳

Best Essay Service:
CustomPapers form ◳

Excellence in Editing:
Rose Editing ◳

AI-Paper Rewriting:
Robot Rewrite ◳