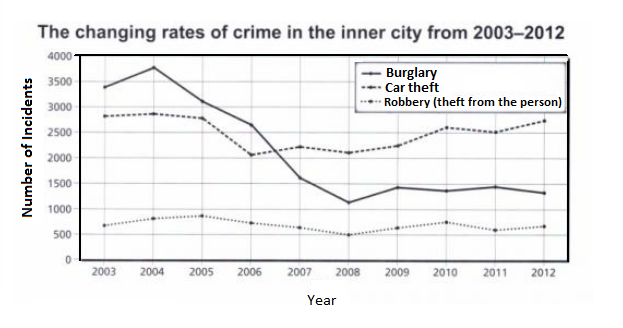
different crime cases in the New Port city
The chart below shows the changes that took place in three different areas of crime in New Port city center from 2003-2012
The given graph presents information about the variation of three different tipes of crime in New Port city between the years 2003 and 2012.
Overall, it can be seen that there was a downward trend in the number of burglaries, while thefts remained low but steady.
As regards burglaries, the figure started at about 3500, which was the highest figure in 2003. After that, there was a significant decrease to approximately 1500 in 2007 reaching the peak at just over 1000 in 2008. Next, there was a sligth increase at around 1500 in 2009. From 2009 to 2012 the figure levelled off at around 1500 ending at about 1400 in 2012.
In contrast , in 2003 the number of incidents by robberies was the lowest compared to the crime rate of both burglary and car theft. The number of thefts fluctuated mildly for the whole period, reaching the bottom at around 600 in 2012.
Regarding the car thefts rate, the figure started at about 2700 in 2003, having remained stable for 2 years, then fell sharply hitting the peak at approximately 2000 in . In 2012 the number of car thefts saw a rise to rougly 3000 , exceeding the number of burglaries, which had only about 1500.

Academic_IELTS_Writi.png
