Summarize the information by selecting and reporting the main features
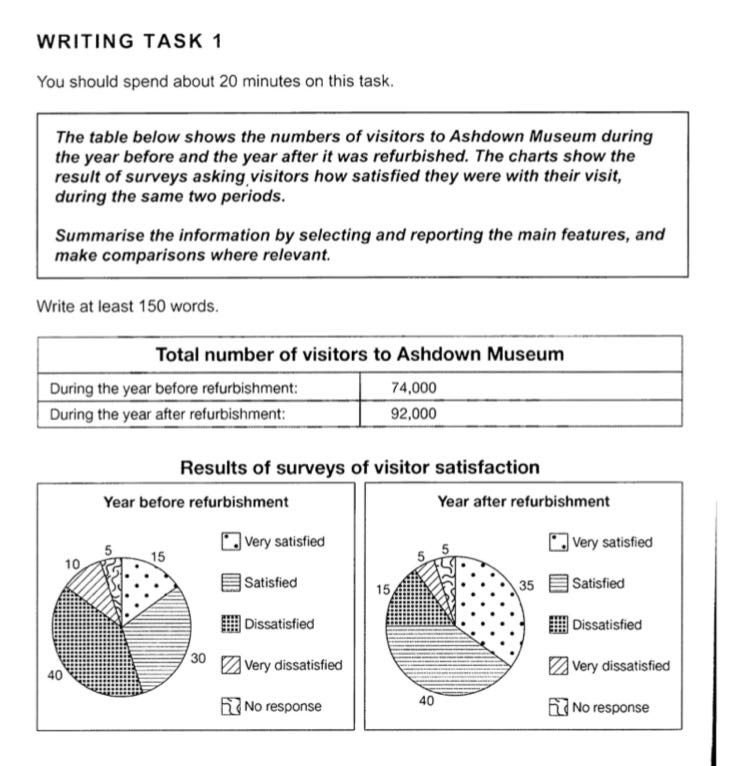
The table compares the number of Ashdown Museum visitors before and after refurbishment for a one year period each. The pie chart illustrates the proportion of visitor satisfaction during the same period,
Overall, the number of people who satisfied with the museum increased after the refurbishment. Meanwhile, the proportion of people who didn't respond was same during the period surveyed.
Regarding to the table, the number of visitors showed a significant increase of 18,000 to 92,000 over the whole period. Moreover, the proportion of people who satisfied or very satisfied with the museum also increased from 30% to 40% and from 15% to 35% respectively.
On the other hand, the proportion of people who dissatisfied or very dissatisfied decreased from 40% to 15% and from 10% to 5% respectively. The percentage of people who didn't respond to survey remained at 5%, yet the exact number of those increased.

56D6BB9FB2934A768.jpeg
