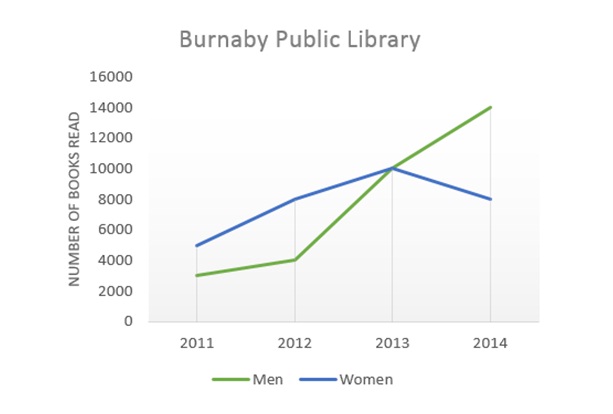
The line graph illustrated the rate of books read by men and women in Burnaby Public Library between 2011 and 2014. There was a value measured in percentage in the number of books. The most obvious pieces of information are that, there was an accurately the same point by both in the rate of books read by men and women in 2013.
To begin, the level of books read by women stood at around 5,000 books in 2011, which is higher than the level of books read by men that stood at around 3,000 books. However, in the end of this period, the figure of books read by men more than the number of women, 14,000 and 8,000 respectively in 2014.
2011 to 2012 witnessed a gradual rise in the figure of books read by men and which was followed by significant increase between 2012 and 2014. In contrast, the level of books read by women was a steady rise from 2011 to 2013 and which was followed by a sharp fall in the end of this period.

burnaby.jpg
