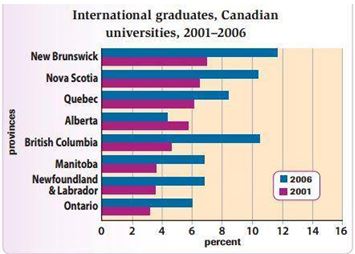
The bar chart reveals information about the number of foreign learners alumni from college in several towns in Canada over five-year period. Overall, except Alberta, others countries was by far the most significant changed. Also, New Brunswick levels was by far the highest proportions of others.
New Brunswick levels far dominated of graduating people both of the years at 7% (2001) and approximately 12% (2006). This was followed by British Columbia, almost 5 % in the first of year and around 11% in the last of year. In addition, the large gap was seen in the level of British Columbia by 6% when it came to 2006. Unsurprisingly, both Manitoba and Newfoundland&Labrador still stayed the same of proportion by 3% in the former year and 7% in the latter one.
Turning to the another diverge proportion, Alberta proportions experienced a decline of number by 4% when it moved to the end of year. Other level of countries performs only a big-scale for alumni college proportion.

graduate.JPG
