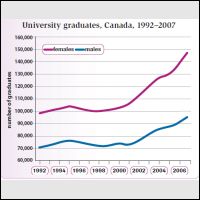
The given graph provides the data about the number of university graduates between the two genders in Canada from 1992 to 2007. Overall, the number of graduated scholars experienced the similar pattern for female and male which is the upward trend. However, the female trend broke the record as the high one.
According to the line graph, the starting number of female scholars in 1992 was lower than 100,000. Even though the female trend was sharply decreased in 1998, it was slowly increased in the end of 2000 with more than 100,000 female students released by the university. In contrast, started with 70,000, the growth of the number of male students graduated from university was steadily increased. In 1995, the trend achieved the number 75,000 while it experienced the same decreasing trend in 1998.
At more detailed looked at, both of female and male trends were sharply increased since 2001. However, in 2007, female reached the peak with 145,000 while male remained with 95,000, making the gap between them widened.

line_chartr.jpg
