Hi guys, this is my second report based on statistics after finding how to write these task 1of IELTS. Please give me feedback when you read it. Thanks in advance.
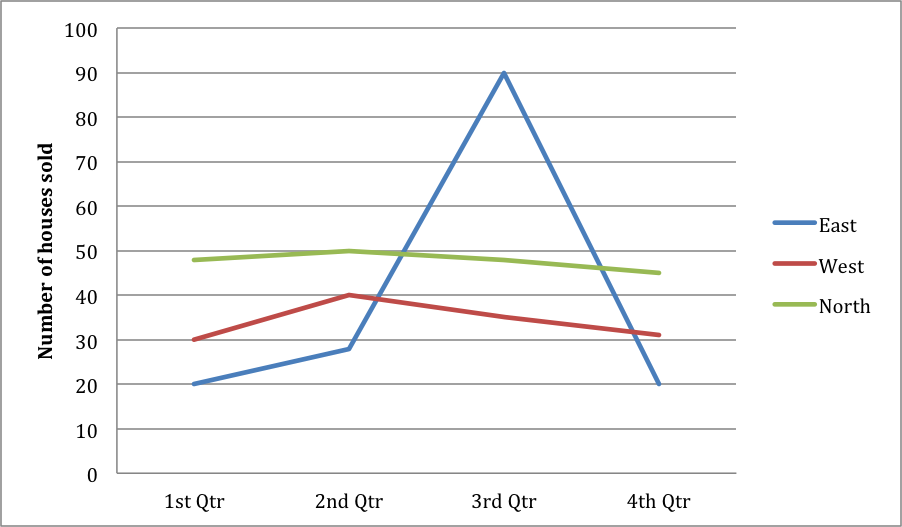
The line graph illustrates the number of houses that were sold in three areas of UK in 2000.
The number of houses sold in three area of UK all was always lower than the cap of the first quarter. A trend, which is the number of houses sold, of the North is associated with the West, whereas that of the East dramatically fluctuates.
In 1st quarter, on average, the number of people who brought houses was 20 in the East following by the West and North with 30 and approximately 50, respectively. In the next 3 months, houses sold in the East gradually increased to about 30. Starting at this value, the highest number of houses sold was dramatically recorded at 90. However, in the end of period, the number of houses sold in the East decreased considerably to the value of 1st quarter.
In contrast, the number of houses sold in the North and the West seems less different than that of the East. The number of house purchasers in the North slightly increased to round 50 and then slowly declined to 45, which lower than that in the first quarter. Similarly, the number of houses sold in the West gradually went up to 40 and after slowly dropped by about the same as the value of the first quarter.

task1changeshouse.png
