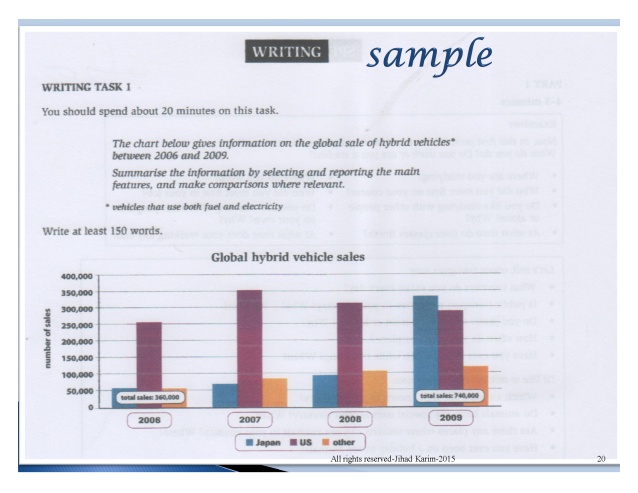
The bar chart illustrates the global sale of hybrid vehicles in US, Japan, and Other countries between 2006 and 2009. Overall, it can be seen that the greatest change was in the number of transportation sales in Japan.
To begin, the number of sales in Japan stood at 50.000 vehicles which had similar amount to other countries but that of US stood at 250.000 units and it was the highest number in which total of sales was 360.000 units in 2006. In the next following year, US transport sales peaked at 350.000 and Japan sales rose gradually to 53.000 similar with other nations at 60.000. In contrast, the sales of US plunges to 310.000 while in Japan and other countries transaction increased gradually in 2008. Finally, in the 2009, Japan sale of vehicles increased sharply to 340.000, whereas sales of hybrid in other countries rose to 110.000 units. On the other hand, the sales of hybrid transportation in US had decreased steadily to 290.000 units. As a result, the total of unit sales was 740.000 in the end period and two times greater than in the beginning period.
To begin, the number of sales in Japan stood at 50.000 vehicles which had similar amount to other countries but that of US stood at 250.000 units and it was the highest number in which total of sales was 360.000 units in 2006. In the next following year, US transport sales peaked at 350.000 and Japan sales rose gradually to 53.000 similar with other nations at 60.000. In contrast, the sales of US plunges to 310.000 while in Japan and other countries transaction increased gradually in 2008. Finally, in the 2009, Japan sale of vehicles increased sharply to 340.000, whereas sales of hybrid in other countries rose to 110.000 units. On the other hand, the sales of hybrid transportation in US had decreased steadily to 290.000 units. As a result, the total of unit sales was 740.000 in the end period and two times greater than in the beginning period.

HYBRID_VEHICLES.jpg
