IELTS TASK 1: GLOBAL HYBRID VEHICLE SALES
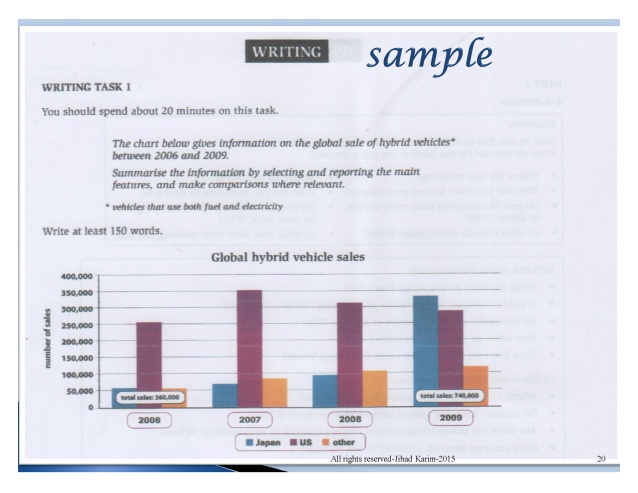
The chart below gives information on the global sale of hybrid vehicles between 2006 and 2009.
Summarise the information by selecting and reporting the main features, and make comparisons where relevant.
A breakdown of the transportation which uses both of fuel and electricity sales around the world from 2006 to 2009, a 4-year period, is described in the bar chart. Overall, the number of the hybrid vehicles which sold increased dramatically. In any case, US was the country with the largest total of buying.
During 2006 to 2008, 3-year period, the number of the trading in Japan and other countries rose slightly. Begin with both area which stood at around 50,000 sales in 2006. In addition Japan has sharp enhancement to about 300,000 in 2009, while other remained stable for the entire period.
In contrast to this, US experienced fluctuation during the period, which stood at over 250,000 in the first year and peaked at 350,000 in the next year. The biggest rise of the vehicle which uses both of fuel and electricity trading in US occurred between 2006 and 2007, by 100,000 sales improvement.

ieltsupdatedpdf20.jpg
