Birth Rates in China and the USA
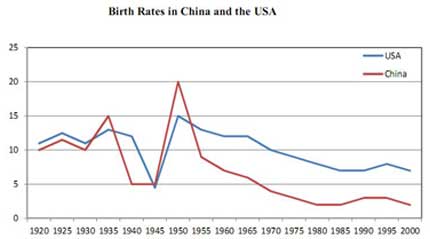
Compare changes in the birth rates of China and the USA between 1920 and 2000. Overall, the graph provided illustrates some astonishingly similarities between the Chinese and the US birth rates during the period from 1920 to 2000. It is clear that both nations experienced significant fluctuations in fertility with lows during the 1940s and highs during 1950s.
During the first two decades, there was a rise of 5 percent from 1920 to 1935 of China's birth rates, then it dramatically dropped to a low of just 5 percent in 1940, this was followed by a sustained growth which reached a peak of 10 percent in 1930. The latter half of the graph, however, brought a sustained declined in this figure.
The US birth rate, mean while, fluctuated at somewhere between 11 and 13 percent prior to 1930, then declining to 5 percent in 1945. 5 years after that, it saw a marked rise in this rate, to somewhere in the vicinity of 15 percent in 1930, followed by a steady fall.
It is worth noting that while the birth rates both countries were very similar until 1950, the gap between them made a distance after this time as fertility in China slid away.

ieltsreportbirthr.jpg
