UK students statistics - the chart and graph
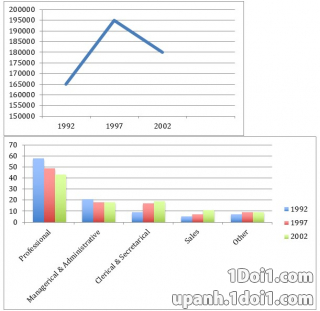
The graph and the chart give information about the number of new graduates and their employment in the UK from 1992 to 2002.
UK
The chart compares te percentages of UK students graduating wit third occupation between 1992 and 2002.
Overall , It is clear that the graduates figure of British students in the first five years before declining in the later five years of period . Professional fields was chosen by most students after graduated.
In the line graph. The rate shows about 165 thousand students graduates from university in 1992. There was a dramatic rise in the rate to 30 thousand after five years .Then, this rate declined to 180 thousand at the end of this period.
Regarding employment chart, the professional data was the highest, just under 60% which students graduates worked in and declined by 5% each five years period. The same trend was repeated in the figure for management and administration, despite its figure was only equal to a third. In contrast, despite a rise, the percentages of students working as clerks and secretaries, sales and others were trivial, ranging from about 5% to 8% only.

c2iIXbr.jpg
