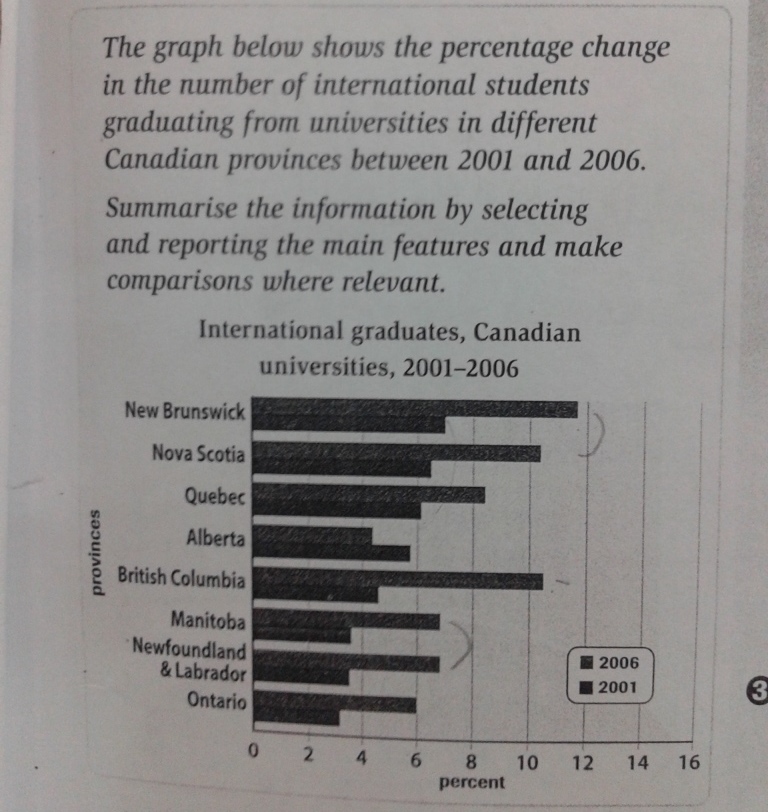
A breakdown of the proportion alter in the number of overseas pupils graduated from universities in several Canadian provinces from 2001 to 2006, a 5-year period is illustrated in bar chart. Overall, there were upward trend in all of provinces, with exception in Alberta. In any case, the number of New Brunswick saw the highest percentage, while the figure for Alberta decreased slightly over the period.
Graduate numbers rose during the 5 years and reached their highest levels in 2006, but there was a minimal drop in Alberta graduates. In 2001, the number of foreign graduates in New Brunswick, Nova Scotia, Quebec stood at around 7%. However, by 2016 there had been more significant growth in three provinces numbers. That year, they rose to 8% (Quebec), 10% (Nova Scotia), 11% (New Brunswick) as the largest proportion of International graduates. Thus the gap between 2001 and 2006 in the number of three provinces had widened.
A more detailed look at the graph reveals that the overall growth in numbers in Manitoba and Newfoundland & Labrador had similar pattern. It experienced a gradual increased by 7% from 2001 to 2006, compared to 6% for Ontario. As the same way, the number of overseas students graduated in British Columbia rose markedly to 10% in 2006. In contrast, that was followed by a period of about five years, when number fell just over 4% Alberta. However, other graduate numbers saw their strongest growth rate, and this was well above the increases that had been seen in the end of period.

20151111_110851.jpg
