Unanswered [1] | Urgent [0]
  

Home / Writing Feedback   % width   Posts: 3


The number of students graduating from university in Canada in a period of 15 years


Goldengoat 4 / 8  
Aug 29, 2021   #1

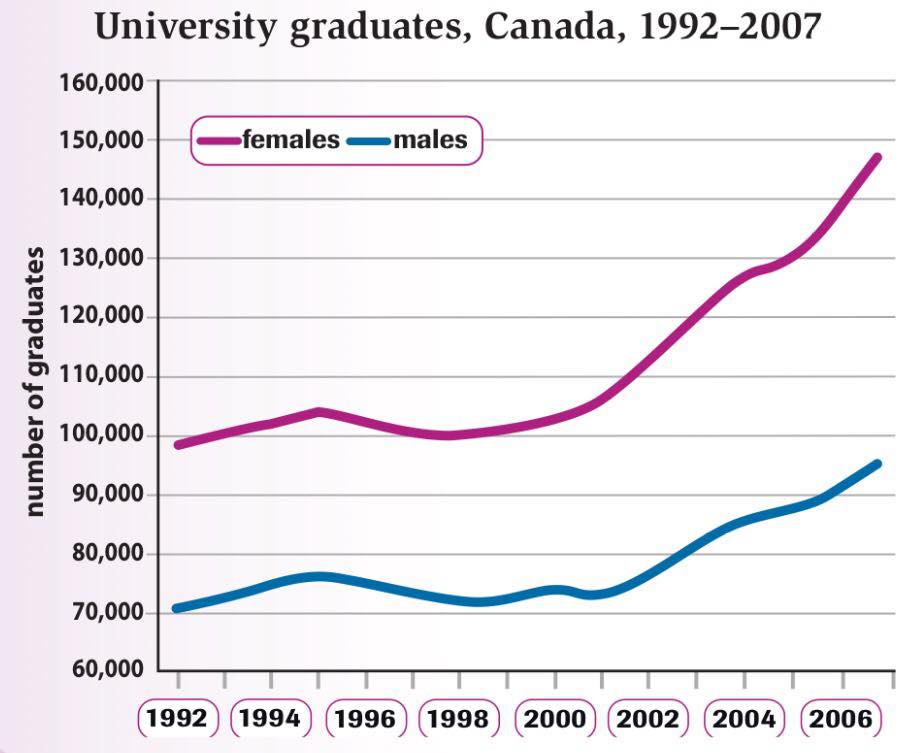
The graph below shows the number of university graduates in Canada from 1992 to 2007.


Summarise the information by selecting and reporting the main features and make comparisons where relevant.

The number of students graduating from university in Canada in a period of 15 years is vividly depicted in the line chart given, starting from 1992.

From the graph, it is obviously that the figures of both male and female graduates in Canada from 1992 to 2007 experienced an upward trend. Moreover, female graduates outnumbered male ones.

Starting in 1992, Canada had approximately 70,000 males who got their university diplomas. This number then increased to about 75,000 and went down slightly to just over 70,000 in 1999. From 2001, more male students completed their course at the university, the number growing significantly from 72,000 in 2001 to 98,000 in 2007.

Nearly 100,000 Canadian females were awarded with a degree for completing their course at the university in 1992. This number then went up to about 102,000 in 1996 and declined to exactly 100,000 in 1997. From 1997 to 1999, it remained stable before it started to surge dramatically from the year 2000 and finally reached its peak at just below 150,000.

  • 79500073A3C0452F8.jpeg


Holt  Educational Consultant - / 15385  
Aug 31, 2021   #2
Avoid exaggerated references such as "vividly depicted". This is an academic or professional report. Keep the tone formal and use only relevant wording in the report presentation. Do not use creative writing references as these tend to reduce the formality of the presentation. The use of the word "obviously" is also out of place in this essay for the very same reason. Additionally, the writer should assume that the reader / examiner will not have access to the image / cannot view the image, so references to what is seen clearly in the image should not be made. These references should be clear, without making the reader feel "dumb" or stressed out due to confusion, if instances do not allow the reader to view the image along with the report.
aanh1009 5 / 11  
Sep 5, 2021   #3
You shouldn't put too much statistics in a Writing task 1 essay because this will bring fatigue for readers and also unnecessary because figures can be easily seen in the chart. Instead, you should only talk about its outset, its peak how it changes ( increase, decrease, fluctuate, stabilize at,.....). Good luck


Home / Writing Feedback / The number of students graduating from university in Canada in a period of 15 years
Do You Need
Academic Writing
or Editing Help?
Fill out one of these forms:

Graduate Writing / Editing:
GraduateWriter form ◳

Best Essay Service:
CustomPapers form ◳

Excellence in Editing:
Rose Editing ◳

AI-Paper Rewriting:
Robot Rewrite ◳

Academic AI Writer:
Custom AI Writer ◳